By Michael Tubbs | Posted on October 29, 2019 10:03 AM
Broadway Show Ticket Sales Analysis Chart w/e 10/27/2019 Plus News Of The Who's Tommy Revival, Dismal Ticket Sales For Lightning Thief and A Beautiful Closing Of Beloved Carole King Jukebox Musical
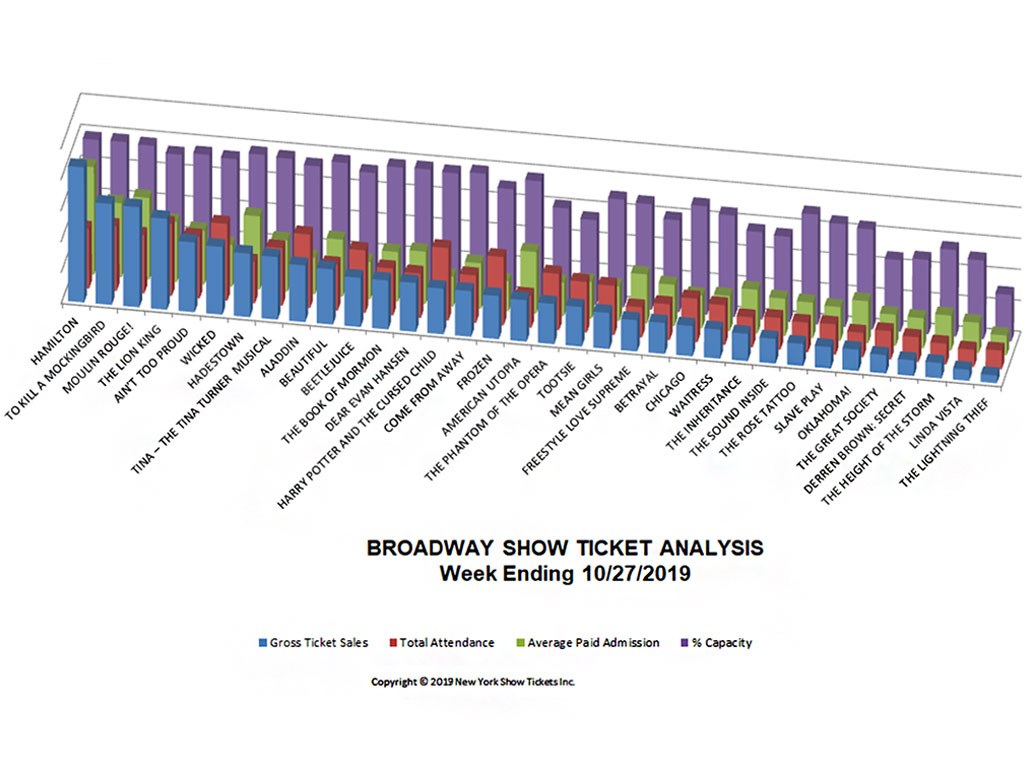
| # | Show Name | Gross | TotalAttn | %Capacity | AvgPdAdm |
| 5 | AIN’T TOO PROUD | $1,530,810 | 11,082 | 97.28% | $138.13 |
| 9 | ALADDIN | $1,242,732 | 13,225 | 95.72% | $93.97 |
| 17 | AMERICAN UTOPIA | $910,606 | 5,744 | 99.62% | $158.53 |
| 10 | BEAUTIFUL | $1,209,465 | 8,258 | 100.61% | $146.46 |
| 11 | BEETLEJUICE | $1,079,679 | 11,254 | 94.22% | $95.94 |
| 22 | BETRAYAL | $678,449 | 6,399 | 77.21% | $106.02 |
| 23 | CHICAGO | $667,724 | 7,858 | 90.95% | $84.97 |
| 15 | COME FROM AWAY | $1,000,793 | 8,526 | 101.89% | $117.38 |
| 13 | DEAR EVAN HANSEN | $1,071,494 | 7,971 | 101.26% | $134.42 |
| 31 | DERREN BROWN: SECRET | $340,648 | 4,437 | 62.39% | $76.77 |
| 21 | FREESTYLE LOVE SUPREME | $685,578 | 5,428 | 88.69% | $126.30 |
| 16 | FROZEN | $948,568 | 12,247 | 90.91% | $77.45 |
| 7 | HADESTOWN | $1,395,854 | 7,444 | 101.36% | $187.51 |
| 1 | HAMILTON | $2,965,824 | 10,753 | 101.52% | $275.81 |
| 14 | HARRY POTTER AND THE CURSED CHILD | $1,001,780 | 12,976 | 100.00% | $77.20 |
| 33 | LINDA VISTA | $240,198 | 3,090 | 66.03% | $77.73 |
| 20 | MEAN GIRLS | $790,543 | 8,862 | 90.43% | $89.21 |
| 3 | MOULIN ROUGE! | $2,197,947 | 10,494 | 100.75% | $209.45 |
| 29 | OKLAHOMA! | $469,965 | 4,364 | 83.79% | $107.69 |
| 28 | SLAVE PLAY | $471,770 | 5,469 | 86.21% | $86.26 |
| 12 | THE BOOK OF MORMON | $1,073,831 | 8,456 | 100.96% | $126.99 |
| 30 | THE GREAT SOCIETY | $404,145 | 5,097 | 60.11% | $79.29 |
| 32 | THE HEIGHT OF THE STORM | $335,445 | 3,739 | 72.69% | $89.72 |
| 25 | THE INHERITANCE | $602,019 | 5,377 | 73.30% | $111.96 |
| 34 | THE LIGHTNING THIEF | $173,120 | 3,368 | 39.24% | $51.40 |
| 4 | THE LION KING | $1,999,095 | 12,924 | 95.25% | $154.68 |
| 18 | THE PHANTOM OF THE OPERA | $881,183 | 10,130 | 78.89% | $86.99 |
| 27 | THE ROSE TATTOO | $488,030 | 5,321 | 92.25% | $91.72 |
| 26 | THE SOUND INSIDE | $544,698 | 5,710 | 71.52% | $95.39 |
| 8 | TINA – THE TINA TURNER MUSICAL | $1,371,009 | 10,346 | 100.00% | $132.52 |
| 2 | TO KILL A MOCKINGBIRD | $2,217,401 | 11,679 | 101.73% | $189.86 |
| 19 | TOOTSIE | $866,274 | 9,112 | 71.10% | $95.07 |
| 24 | WAITRESS | $640,982 | 7,124 | 85.22% | $89.97 |
| 6 | WICKED | $1,486,185 | 13,823 | 95.62% | $107.52 |
| TOTALS | $33,983,842 Dollars | 278,087 People |
This Week on Broadway: Beautiful Closes, Lightning Disappoints And Utopia Climbs
After its 5 year run on Broadway Beautiful The Carol King Musical at the Lunt Fontanne Theatre had its final performance on October 27th, 2019 and drew brisk ticket revenues.
The Lightning Thief has managed to set a recent-record for the lowest Broadway ticket sales in a week where the show brought in just $173,120 in ticket sales for the week, for 3,368 seats that equates to 39.24% of their tickets were sold that resulted in an average ticket price of $51.40 per ticket, that demonstrates that the vast majority of their tickets were given away to friends, family and papering services.
Total Broadway Sales Down This Week
This weeks total Broadway sales number was down 1% from last week to $34 Million with American Utopia having a $300k increase in ticket sales from last week, mostly due to the positive buzz about the show.
Tommy To Return, Parker Learns To Drive Again
It was announced this week that The Who's Tommy is set to return to Broadway in January 2021. Tickets went on sale for How I Learned to Drive starring Mary-Louise Parker and David Morse.
The Broadway show ticket analysis raw data has been provided courtesy of The Broadway League and has been collated and analyzed by the New York Show Tickets data team. All data, text, opinion, charts and commentary are copyright © 2019 nytix.com