By Jennifer R Jones | Posted on October 14, 2015 10:28 PM
The Entire Broadway Industry Saw A Boost This Week, With All But 3 Of The 31 Shows Demonstrating An Increase In Ticket Sales, Two New Shows Got Off To A Good Starts: Allegiance And On Your Feet!
This Week’s Notable Movements on Broadway are:
Two New Shows: “On Your Feet!” and “Allegiance”
In the week ending October 11, 2015, two new show began previews. On October 6, 2015, Allegiance played its first performance at the Longacre Theatre. Starring George Takei in his Broadway debut, this musical also stars Lea Salonga and Telly Leung. In its first week of previews, which was a full eight performance week, the show brought in $608,241, which represents 63.36% of its gross potential. With a top ticket price of $223.00, the average paid admission was $80.57, and the audience was filled to an average capacity of 89.3%. This is a fairly good start for a new musical for which buzz is only starting to build, and once it opens on November 8, 2015, the reviews will determine whether that buzz will spread like wildfire.
On Your Feet! also began previews starting on October 5, 2015, playing seven performances in its first week. This musical tells the life of Gloria and Emilio Estefan, from her serious spinal injury flashing back to the start of her career and all the glory that followed. In its first week of performances, the show brought in $970,013, which represents 63.99% of its gross potential. With a top ticket price of $199.00, the average paid admission was $96.54, and the audience was filled to an average capacity of 87.6%. This is a very good start for a new musical, almost reaching one million dollars over just seven performances. Though there is room for growth in the large Marquis Theatre, this is an excellent beginning of the run indeed.
Broadway Fall Season is Finally Underway with Major Box Office Increases
This past week, out of the 31 shows currently running, the entire industry experienced a collective box office increase of $4,754,804. This is by far the highest collective increase in a long time, and it indicates that the Broadway fall season is finally entering high gear with all the new shows entering previews. Of these 31 shows, all but three saw an increase in ticket sales. The only decreases were very minor, with the most severe being Dames at Sea which decreased by $35,120 to reach the dangerously low gross of $194,663. Furthermore, The Gin Game decreased by $10,265 to reach the mediocre gross of $341,483, and Hand to God decreased by the negligible amount of $5,670 to bring in the threateningly low gross of $232,405. Otherwise, the whole industry did very well.
Other than the two new shows, the biggest increase was seen by Wicked, which went up by $310,698 to earn a weekly gross of $1,765,268. Aladdin went up by $275,938 to reach a gross of $1,641,903, and Hamilton went up by $196,919 to reach a weekly gross of $1,678,091. In its second week of performances, and first full week, Sylvia went up by $274,550 due to the added performances, but still only brought in a weekly gross of $398,750. Other large increase were seen by Matilda at an increase of $207,343, Finding Neverland at an increase of $182,233, Kinky Boots at an increase of $166,845, The Lion King at an increase of $140,837, The Phantom of the Opera at an increase of $140,836, and Something Rotten! at an increase of $139,646.
The Following are the Broadway Ticket Sales Numbers for the Week Ending October 11, 2015:
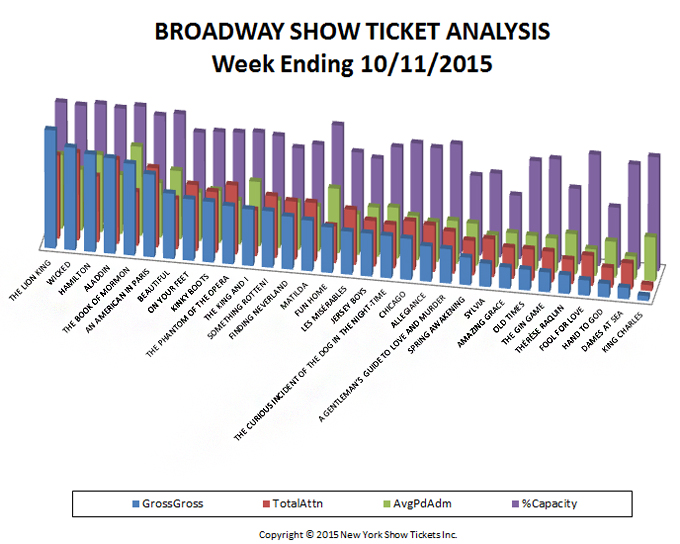
| Show Name | GrossGross | TotalAttn | %Capacity | AvgPdAdm |
| A GENTLEMAN’S GUIDE TO LOVE AND MURDER | $589,491 | 6,823 | 94.03% | $86.40 |
| ALADDIN | $1,641,903 | 13,722 | 99.32% | $119.65 |
| ALLEGIANCE | $608,241 | 7,549 | 89.27% | $80.57 |
| AMAZING GRACE | $364,176 | 5,058 | 54.41% | $72.00 |
| AN AMERICAN IN PARIS | $1,423,525 | 12,908 | 96.10% | $110.28 |
| BEAUTIFUL | $1,124,410 | 8,131 | 99.06% | $138.29 |
| CHICAGO | $708,028 | 7,930 | 91.78% | $89.28 |
| DAMES AT SEA | $194,663 | 4,203 | 90.12% | $46.32 |
| FINDING NEVERLAND | $907,028 | 9,464 | 78.66% | $95.84 |
| FOOL FOR LOVE | $263,338 | 4,894 | 95.74% | $53.81 |
| FUN HOME | $782,817 | 5,997 | 101.30% | $130.53 |
| HAMILTON | $1,678,091 | 10,717 | 101.41% | $156.58 |
| HAND TO GOD | $232,405 | 3,192 | 51.68% | $72.81 |
| JERSEY BOYS | $738,191 | 7,431 | 75.64% | $99.34 |
| KING CHARLES | $85,080 | 959 | 98.16% | $88.72 |
| KINKY BOOTS | $1,040,633 | 9,867 | 86.61% | $105.47 |
| LES MISÉRABLES | $740,253 | 8,969 | 79.57% | $82.53 |
| MATILDA | $869,471 | 9,528 | 83.17% | $91.25 |
| OLD TIMES | $356,649 | 5,072 | 85.68% | $70.32 |
| ON YOUR FEET! | $970,013 | 10,048 | 87.63% | $96.54 |
| SOMETHING ROTTEN! | $1,055,639 | 10,735 | 84.63% | $98.34 |
| SPRING AWAKENING | $474,057 | 5,617 | 68.43% | $84.40 |
| SYLVIA | $398,750 | 6,162 | 71.92% | $64.71 |
| THE BOOK OF MORMON | $1,576,943 | 8,747 | 102.57% | $180.28 |
| THE CURIOUS INCIDENT OF THE DOG IN THE NIGHT-TIME | $726,046 | 7,079 | 86.92% | $102.56 |
| THE GIN GAME | $341,483 | 4,983 | 88.76% | $68.53 |
| THE KING AND I | $972,301 | 7,464 | 89.11% | $130.27 |
| THE LION KING | $2,033,230 | 13,571 | 100.02% | $149.82 |
| THE PHANTOM OF THE OPERA | $997,919 | 11,239 | 87.53% | $88.79 |
| THÉRÈSE RAQUIN | $321,284 | 3,967 | 64.88% | $80.99 |
| WICKED | $1,765,268 | 14,280 | 98.78% | $123.62 |
| Totals | $25,981,324 | 246,306 | 86.55% | $98.67 |
Broadway ticket sales raw data are provided courtesy of The Broadway League All other data, text, opinion, charts and commentary are copyright © 2015 nytix.com