By Jennifer R Jones | Posted on October 26, 2015 11:57 AM
Three New Shows Began Previews: A View From The Bridge, China Doll, And Misery, The Latter Two Of Which Are Showing Early Signs Of Seeing Box Office Success, Older Shows Saw A Decrease In Sales
This Week’s Notable Movements on Broadway are:
“China Doll” and “Misery” – Excellent Performers Right Out the Gate
In the week ending October 18, 2015, two new shows began previews and brought in over 100% of their gross potential right out the gate. The David Mamet play China Doll, which stars frequently collaborator and box office magic Al Pacino, brought in $1,072,111 at the box office in its first partial week of six performances. This represents an astonishing 112.0% of the gross potential. With a top ticket price of $350, the average paid admission was $166.37, which goes to show that David Mamet and Al Pacino is a winning combination for ticket buyers. The producers Jeffrey Richards and Jerry Frankel are also very fortunate to have secured these artists in their producing portfolio.
The show will officially open on November 19, 2015, and is scheduled to run for a limited engagement until January 31, 2016. Furthermore, the play Misery by William Goldman began previews on October 22, 2015, playing four performances in the first week of previews. With the Hollywood legend Bruce Willis making his Broadway debut in the play, Misery brought in 104.0% of its box office potential over the course of those four performances, with a weekly gross of $622,939. With a top ticket price of $297, the average paid admission was $134.63, and the audience capacity was filled to an average of 97.9%. Though not quite as amazing as China Doll, Misery is still an extraordinary box office performer in the first week of its run.
“A View From The Bridge” and Older Shows Slow Down
A third show also began previews in the week ending October 18, 2015: A View From The Bridge in a transfer production from the Young Vic in London. Without as recognizable a star as Bruce Willis or Al Pacino, this Arthur Miller classic has another great attraction that is unfortunately not as appealing in terms of box office: an experimental reinterpretation of a modern American classic and a successful run in a cool London theatre. Nevertheless, the producers decided to try their hand at bringing it to Broadway. In the first five preview performances, the outlook isn’t as positive as the other two shows that began previews this past week. Over the five shows, A View From The Bridge brought in $274,654, which represents 56.9% of its gross potential.
With a top ticket price of $248, the average paid admission was $65.02, which shows a fair amount of discounting to fill up to the average audience capacity of 79.9%. This may be a show that picks up once the reviews come out after opening, as the marquee names alone may not entice the average theatregoer. Meanwhile, as new shows are beginning performances, some of the older shows are slowing down. Of the 34 shows that were running this past week, 17 of them did show a decrease in ticket sales, despite an overall increase in the industry of $2,139,508.
Broadway Box Office Sees Overall Increase
This increase is mainly due to the two blockbuster first preview weeks. However, the average gross per show also did go up, from an average of $805,646 last week to an average of $814,596 this week. Anyway, most of the decreases were from older shows that are less enticing to theatre-goers than some of the newer fare.
The Following are the Broadway Ticket Sales Numbers for the Week Ending October 25, 2015:
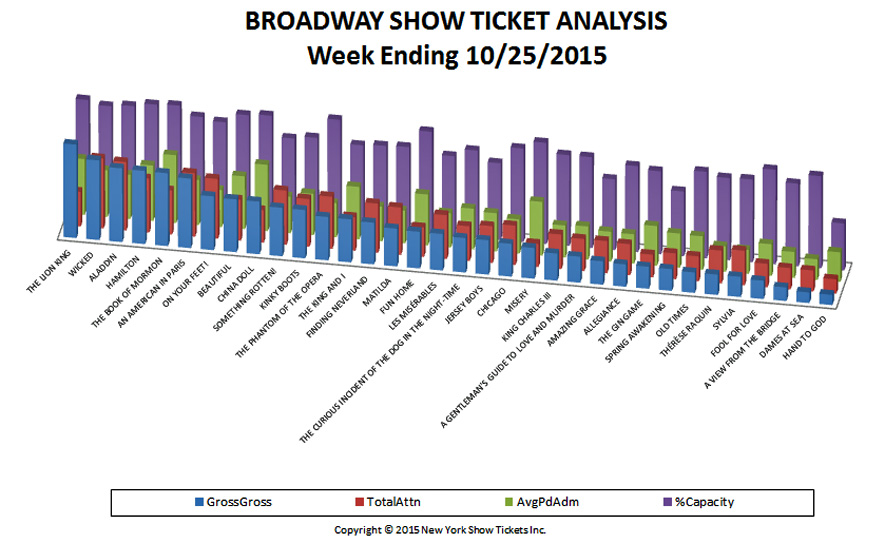
| Show Name | GrossGross | TotalAttn | %Capacity | AvgPdAdm |
| A GENTLEMAN’S GUIDE TO LOVE AND MURDER | $529,853 | 6,375 | 87.86% | $83.11 |
| A VIEW FROM THE BRIDGE | $274,654 | 4,224 | 79.92% | $65.02 |
| ALADDIN | $1,500,799 | 13,537 | 97.98% | $110.87 |
| ALLEGIANCE | $454,318 | 6,151 | 83.13% | $73.86 |
| AMAZING GRACE | $476,631 | 6,359 | 68.41% | $74.95 |
| AN AMERICAN IN PARIS | $1,416,288 | 12,535 | 93.32% | $112.99 |
| BEAUTIFUL | $1,075,201 | 8,124 | 98.98% | $132.35 |
| CHICAGO | $667,269 | 7,803 | 90.31% | $85.51 |
| CHINA DOLL | $1,072,111 | 6,444 | 100.47% | $166.37 |
| DAMES AT SEA | $215,450 | 4,156 | 89.11% | $51.84 |
| FINDING NEVERLAND | $849,283 | 9,760 | 81.12% | $87.02 |
| FOOL FOR LOVE | $371,345 | 4,673 | 91.41% | $79.47 |
| FUN HOME | $745,661 | 5,841 | 98.67% | $127.66 |
| HAMILTON | $1,489,233 | 10,708 | 101.32% | $139.08 |
| HAND TO GOD | $208,655 | 2,805 | 45.42% | $74.39 |
| JERSEY BOYS | $698,868 | 7,290 | 74.21% | $95.87 |
| KING CHARLES III | $551,921 | 6,866 | 87.85% | $80.38 |
| KINKY BOOTS | $981,435 | 9,453 | 82.98% | $103.82 |
| LES MISÉRABLES | $744,129 | 8,673 | 76.94% | $85.80 |
| MATILDA | $768,398 | 9,377 | 81.85% | $81.94 |
| MISERY | $622,939 | 4,627 | 97.86% | $134.63 |
| OLD TIMES | $415,176 | 4,946 | 83.55% | $83.94 |
| ON YOUR FEET! | $1,096,202 | 11,825 | 90.24% | $92.70 |
| SOMETHING ROTTEN! | $986,138 | 10,711 | 80.32% | $92.07 |
| SPRING AWAKENING | $440,948 | 5,135 | 62.56% | $85.87 |
| SYLVIA | $411,079 | 6,861 | 80.08% | $59.92 |
| THE BOOK OF MORMON | $1,483,464 | 8,726 | 102.32% | $170.01 |
| THE CURIOUS INCIDENT OF THE DOG IN THE NIGHT-TIME | $701,819 | 6,873 | 84.39% | $102.11 |
| THE GIN GAME | $446,983 | 4,494 | 80.05% | $99.46 |
| THE KING AND I | $875,907 | 6,670 | 79.63% | $131.32 |
| THE LION KING | $1,901,907 | 13,569 | 100.01% | $140.17 |
| THE PHANTOM OF THE OPERA | $882,925 | 10,324 | 80.40% | $85.52 |
| THÉRÈSE RAQUIN | $413,925 | 6,479 | 79.48% | $63.89 |
| WICKED | $1,621,057 | 13,860 | 95.88% | $116.96 |
| Totals | $27,391,967 | 266,254 | 85.53% | $99.14 |
Broadway ticket sales raw data are provided courtesy of The Broadway League All other data, text, opinion, charts and commentary are copyright © 2015 nytix.com