By Jennifer R Jones | Posted on October 21, 2015 2:01 PM
In The Week Ending October 18, 2015, King Charles Iii Began Previews With Mediocre Box Office For Its First Seven Performances, Overall, The Broadway Industry Was Quite Sluggish This Past Week
This Week’s Notable Movements on Broadway are:
New Show: “King Charles III”
On October 10, 2015, King Charles III began previews at the Music Box Theatre, following a successful run in London first at the Almeida Theatre followed by the West End. In its first week of previews, in which it played seven shows, the play brought in a weekly gross of $470,530. This represents 54.55% of its gross potential. With a top ticket price of $225.00, the average paid admission was $78.75, showing a fair but not immense amount of discounting. Over the course of the seven performances, the average audience capacity was filled up to 87.4%. This is not a bad start, but not an excellent start, for this play.
Ambitious in its taking on a Broadway production against commercial odds, this “future history play,” as it is billed, does not feature any major A-list stars. The title role, King Charles III, is played by Tim Pigott-Smith, who has been on Broadway before but is a much bigger star in his native London. Furthermore, the subject matter is very British, dealing not only with British politics, but also with a counterfactual situation in which the Queen has died and Prince Charles has taken over the throne. Though gripping for London audiences, without a major star (such as Helen Mirren in the comparable but exceedingly successful The Audience), King Charles III may have a tough time selling well at the box office.
Overall a Lower Week than the Previous on Broadway
In the week ending October 18, 2015, 31 shows were running. Of these, the entire Broadway industry saw a collective decrease in ticket sales of $643,783, which is a decrease of 2.55%. Though not hugely significant, the number of shows that individually decreased was not very encouraging. Only 9 of the 31 saw an increase in ticket sales, including the new show King Charles III. Other than that new show, no show increased by greater than five figures. The largest increase was seen by Fool For Love, which went up by $99,777 following very positive post-opening reviews. Thérèse Raquin saw the next biggest increase of $80,012, and Old Times went up by $70,053.
In its final week of performances, Amazing Grace went up by the negligible amount of $44,392, and very minor increases were seen by Les Misérables, The Curious Incident of the Dog in the Night-time, Dames at Sea, and The Gin Game. However, more significant were the decreases in ticket sales. The biggest decrease was seen by Hamilton, which went down by $199,214 to reach the weekly gross of $1,478,877, still outstanding at 110.78% of its gross potential.
A Closer Look at this Week's Broadway Box Office Decreases
Allegiance went down by the startling amount of $140,130 for such a new play, and Something Rotten! went down by $107,969 in its usual series of ebbs and flows. The Lion King also swallowed a comparatively negligible decrease of $101,098 to reach its incredible weekly gross of $1,932,132, and The King and I went down by $88,728. All in all, most of the decreases were in the five figure range, which won’t cause any immediate closures on Broadway, but does show an overall slow week for the industry.
The Following are the Broadway Ticket Sales Numbers for the Week Ending October 18, 2015:
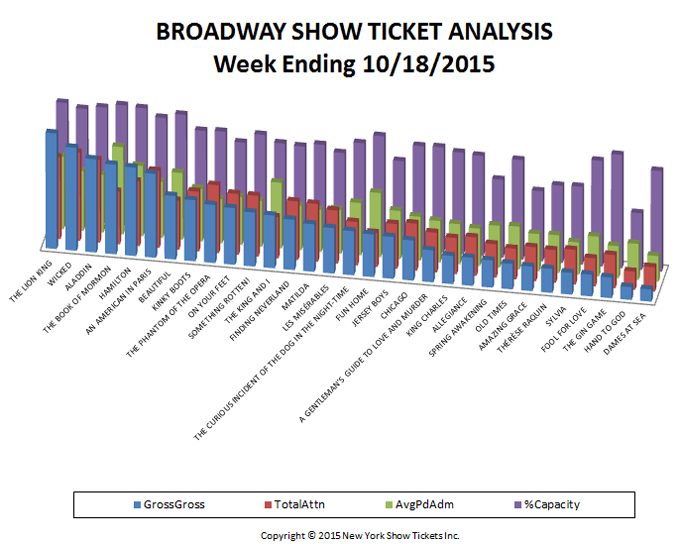
| Show Name | GrossGross | TotalAttn | %Capacity | AvgPdAdm |
| A GENTLEMAN’S GUIDE TO LOVE AND MURDER | $534,257.50 | 6,561 | 90.42% | $81.43 |
| ALADDIN | $1,558,093.50 | 13,685 | 99.05% | $113.85 |
| ALLEGIANCE | $468,111.00 | 6,370 | 86.09% | $73.49 |
| AMAZING GRACE | $408,568.10 | 5,603 | 60.27% | $72.92 |
| AN AMERICAN IN PARIS | $1,402,823.90 | 12,713 | 94.65% | $110.35 |
| BEAUTIFUL | $1,063,244.40 | 8,115 | 98.87% | $131.02 |
| CHICAGO | $670,769.12 | 7,770 | 89.93% | $86.33 |
| DAMES AT SEA | $203,830.25 | 4,042 | 86.66% | $50.43 |
| FINDING NEVERLAND | $841,662.50 | 9,695 | 80.58% | $86.81 |
| FOOL FOR LOVE | $363,115.20 | 4,645 | 90.86% | $78.17 |
| FUN HOME | $713,353.00 | 5,655 | 95.52% | $126.15 |
| HAMILTON | $1,478,877.00 | 10,721 | 101.45% | $137.94 |
| HAND TO GOD | $214,045.48 | 3,019 | 48.88% | $70.90 |
| JERSEY BOYS | $699,846.90 | 7,419 | 75.52% | $94.33 |
| KING CHARLES III | $470,530.00 | 5,975 | 87.37% | $78.75 |
| KINKY BOOTS | $1,021,115.13 | 9,857 | 86.53% | $103.59 |
| LES MISÉRABLES | $759,497.30 | 8,789 | 77.97% | $86.41 |
| MATILDA | $795,271.10 | 9,572 | 83.55% | $83.08 |
| OLD TIMES | $426,702.00 | 5,062 | 85.51% | $84.30 |
| ON YOUR FEET! | $903,937.20 | 10,047 | 87.62% | $89.97 |
| SOMETHING ROTTEN! | $947,670.07 | 10,069 | 79.38% | $94.12 |
| SPRING AWAKENING | $454,006.00 | 5,509 | 67.12% | $82.41 |
| SYLVIA | $364,252.90 | 5,747 | 67.08% | $63.38 |
| THE BOOK OF MORMON | $1,497,672.70 | 8,737 | 102.45% | $171.42 |
| THE CURIOUS INCIDENT OF THE DOG IN THE NIGHT-TIME | $737,747.98 | 7,160 | 87.92% | $103.04 |
| THE GIN GAME | $344,764.49 | 5,475 | 97.52% | $62.97 |
| THE KING AND I | $883,573.00 | 6,845 | 81.72% | $129.08 |
| THE LION KING | $1,932,132.00 | 13,568 | 100.00% | $142.40 |
| THE PHANTOM OF THE OPERA | $970,991.10 | 11,215 | 87.34% | $86.58 |
| THÉRÈSE RAQUIN | $401,296.40 | 5,424 | 66.54% | $73.99 |
| WICKED | $1,720,707.00 | 14,626 | 96.41% | $117.65 |
| Totals | $25,252,464.22 | 249,690 | 85.19% | $95.72 |
Broadway ticket sales raw data are provided courtesy of The Broadway League All other data, text, opinion, charts and commentary are copyright © 2015 nytix.com