This Week On Broadway, Ticket Sales Inched Up To $23.3M As Summer Approaches, The Book Of Mormon Leads With Astounding Ticket Averages, While Ann Struggles With Low Attendance
Total Broadway Ticket Sales Rise

The first week of June saw a small increase in Broadway's total ticket revenue. Ticket sales went up from last week's $23,307,202 to $23,361,631. As schools are letting out and tourists filling New York City, hopefully this bump bodes well for Broadway's summer sales.
Bette Midler Versus Tom Hanks
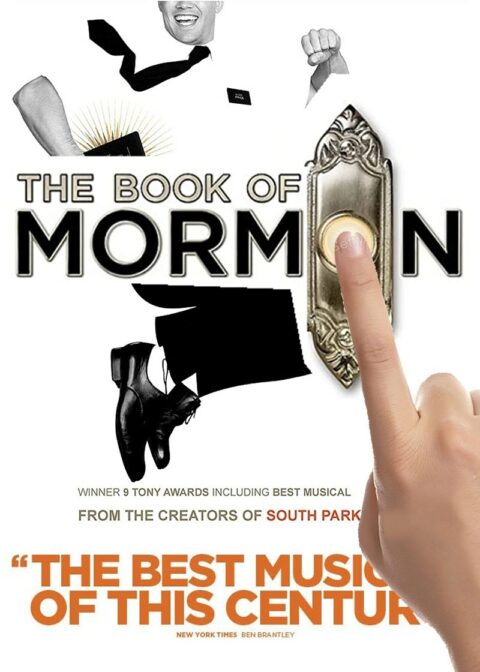
Two of the season's biggest hits have been star vehicles Lucky Guy (featuring Tom Hanks) and the one-woman play I'll Eat You Last: A Chat with Sue Mengers (starring Bette Midler), which are both selling extremely well each week. Though Lucky Guy has easily been beating I'll Eat You Last in total weekly sales due to its being in a much larger theater, the average paid admission numbers show that Midler's fans are forking over more money for their tickets. While Lucky Guy is selling tickets at an average price of $141.25, I'll Eat You Last is earning an average of $145.89 for each ticket. The only show doing better than that is The Book of Mormon, which has a mind-boggling average admission of $197.37.
An at the Back of the Pack
Most of the shows currently playing on Broadway seem to be enjoying relatively healthy numbers, but there are stragglers. The lowest-grossing show currently is Ann, which is not even filling half of its theater and has an average paid admission of $57.00. But with good reviews and word-of-mouth bringing in a steady -- if small -- stream of audience members, the low cost of running a one-woman play has made it possible for the production to continue thus far.
The Following are the Broadway Ticket Sales Numbers from the Week Ending June 9, 2013:

| Show Name | GrossGross | TotalAttn | %Cap | AvgPdAdm |
| ANN | $227,618 | 3,993 | 44.85% | $57.00 |
| ANNIE | $892,876 | 11,082 | 81.10% | $80.57 |
| CHICAGO | $551,149 | 6,919 | 80.08% | $79.66 |
| CINDERELLA | $888,246 | 10,039 | 71.67% | $88.48 |
| I’LL EAT YOU LAST: A CHAT WITH SUE MENGERS | $791,577 | 5,426 | 99.76% | $145.89 |
| JERSEY BOYS | $859,329 | 8,409 | 85.60% | $102.19 |
| KINKY BOOTS | $1,411,574 | 11,436 | 100.39% | $123.43 |
| LUCKY GUY | $1,361,346 | 9,638 | 101.92% | $141.25 |
| MACBETH | $303,522 | 3,928 | 62.83% | $77.27 |
| MAMMA MIA! | $718,464 | 8,439 | 70.42% | $85.14 |
| MATILDA | $1,138,232 | 11,457 | 100.01% | $99.35 |
| MOTOWN: THE MUSICAL | $1,395,663 | 12,139 | 100.69% | $114.97 |
| NEWSIES | $867,823 | 9,332 | 98.44% | $92.99 |
| NICE WORK IF YOU CAN GET IT | $591,160 | 7,291 | 63.33% | $81.08 |
| ONCE | $782,041 | 7,661 | 90.43% | $102.08 |
| PIPPIN | $931,349 | 7,914 | 99.92% | $117.68 |
| ROCK OF AGES | $386,047 | 4,152 | 89.02% | $92.98 |
| SPIDER-MAN TURN OFF THE DARK | $1,034,228 | 12,403 | 80.33% | $83.39 |
| THE ASSEMBLED PARTIES | $347,250 | 4,389 | 84.40% | $79.12 |
| THE BOOK OF MORMON | $1,727,367 | 8,752 | 102.63% | $197.37 |
| THE LION KING | $1,868,936 | 13,513 | 99.36% | $138.31 |
| THE NANCE | $501,724 | 5,864 | 80.02% | $85.56 |
| THE PHANTOM OF THE OPERA | $1,010,069 | 11,775 | 91.71% | $85.78 |
| THE TRIP TO BOUNTIFUL | $450,484 | 5,103 | 60.01% | $88.28 |
| VANYA AND SONIA AND MASHA AND SPIKE | $553,053 | 5,619 | 89.25% | $98.43 |
| WICKED | $1,770,507 | 13,035 | 90.07% | $135.83 |
| Totals: | $23,361,631 | 219,708 | 85.32% | $102.85 |
Broadway ticket sales raw data are provided courtesy of The Broadway League. All other data, text, opinion, charts and commentary are copyright © 2013 nytix.com.


