By Jennifer R Jones | Posted on December 27, 2015 9:17 AM
China Doll Is Performing At More Realistic Numbers For A Low Quality Work, But Broadway Overall Performed Excellently Over Christmas Week, Increasing Over 6 Million Dollars From Last Week
This Week’s Notable Movements on Broadway are:
Big Jump During Christmas Week for Broadway Box Office
In the week ending December 27, 2015, Broadway saw a major upturn in ticket sales. This is to be expected, as many people have off work and school, and use the vacation opportunity to visit New York and attend a Broadway show. This past week, of the 37 shows currently running, the overall box office increased by $6,786,998, to reach a collective weekly gross of $36,271,800. The biggest increase was seen by long-running favorite The Phantom of the Opera, which increased by $598,751 in comparison to last week, bringing in a weekly gross of $1,458,784. Close behind was The Illusionists – Live on Broadway, which increased both because they played 10 performances as compared to last week’s eight, but also in terms of percentage reached of gross potential.
With an increase of $543,181 to reach a weekly gross of $1,362,681, the percentage of gross potential increased from 65.78% across last week’s 8 performances, to 87.50% across this week’s 10. This is the first time this incarnation of The Illusionists crossed the million dollar mark, with one week to go in its run. Other large increases were seen by Fiddler on the Roof which went up by $502,039, Wicked which went up by $497,702, School of Rock which went up by $483,128, The Lion King which went up by $435,779, Aladdin which went up by $390,545, Les Misérables which went up by $355,802, and The King and I with an increase of $352,615.
Audiences Finally Getting a Reality Check with “China Doll”
With the word around town that David Mamet’s latest play China Doll, which stars Al Pacino, is more of a joke than a work of greatness, the box office is finally demonstrating this fact. Despite reports from before the show opened that Pacino was using a teleprompter and Mamet refused to attend preview performances, China Doll’s box office started off with a bang, bringing in over 100% of its gross potential for six out of the first seven weeks of the run.
This past week, the show finally dipped to more realistic numbers, if still inflated compared to quality. Over the course of the show’s six performances that week, the weekly gross was $610,775, which represents just 68.41% of its gross potential. Among the many rules that Mamet and Pacino are breaking in terms of etiquette, the production is picking and choosing how many performances to play each week, generally fluctuating between six and seven, as opposed to the standard eight.
Pachino's Performance May Not Be Enough for Broadway Show
It is true Pacino’s is a demanding performance as the play is mostly carried by one actor, but many other Broadway shows have done as or more demanding parts eight times a week; the emotional strain of executing such a questionable piece of work may be greater than the energy to perform the character. With a month left in its run, the grosses for China Doll may continue to decrease, but the show will still have made out pretty well financially on the names of its cast and creative team alone. Perhaps audiences may not be duped so easily with Mamet’s next original play.
The Following are the Broadway Ticket Sales Numbers for the Week Ending December 27, 2015:
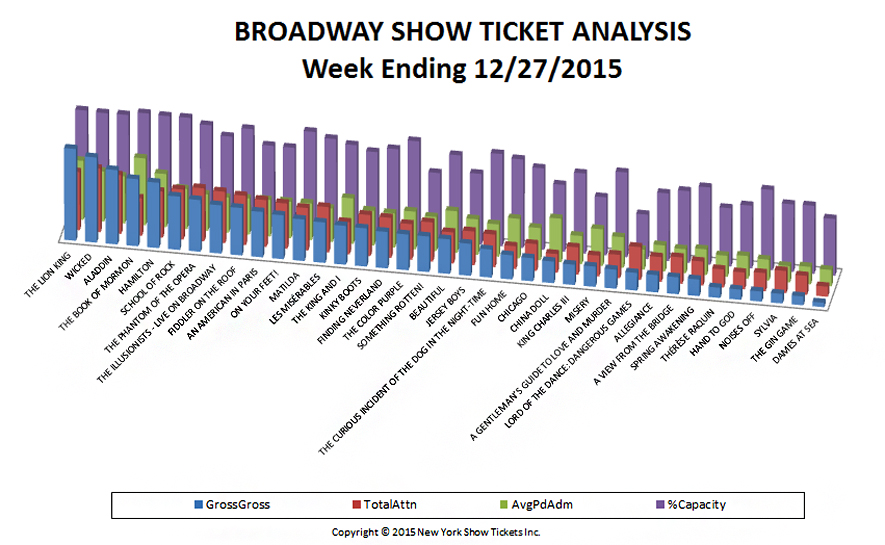
| Show Name | GrossGross | TotalAttn | %Capacity | AvgPdAdm |
| A GENTLEMAN’S GUIDE TO LOVE AND MURDER | $538,582.36 | 5,447 | 85.79% | $98.88 |
| A VIEW FROM THE BRIDGE | $477,086.50 | 6,135 | 72.55% | $77.76 |
| ALADDIN | $2,095,363.50 | 13,712 | 99.25% | $152.81 |
| ALLEGIANCE | $485,848.50 | 5,783 | 68.39% | $84.01 |
| AN AMERICAN IN PARIS | $1,282,028.50 | 10,884 | 81.03% | $117.79 |
| BEAUTIFUL | $975,638.20 | 7,235 | 88.15% | $134.85 |
| CHICAGO | $652,030.00 | 6,238 | 82.51% | $104.53 |
| CHINA DOLL | $610,775.00 | 4,338 | 67.63% | $140.80 |
| DAMES AT SEA | $123,725.00 | 2,346 | 57.49% | $52.74 |
| FIDDLER ON THE ROOF | $1,339,255.30 | 11,472 | 96.01% | $116.74 |
| FINDING NEVERLAND | $1,029,244.50 | 9,338 | 88.70% | $110.22 |
| FUN HOME | $681,394.20 | 5,307 | 89.65% | $128.40 |
| HAMILTON | $1,844,837.00 | 10,747 | 101.69% | $171.66 |
| HAND TO GOD | $288,113.20 | 3,917 | 63.42% | $73.55 |
| JERSEY BOYS | $903,537.67 | 7,879 | 71.29% | $114.68 |
| KING CHARLES III | $573,988.40 | 6,332 | 81.01% | $90.65 |
| KINKY BOOTS | $1,075,999.00 | 9,565 | 83.96% | $112.49 |
| LES MISÉRABLES | $1,139,925.80 | 10,539 | 93.50% | $108.16 |
| LORD OF THE DANCE: DANGEROUS GAMES | $497,914.92 | 7,682 | 45.02% | $64.82 |
| MATILDA | $1,172,663.00 | 9,904 | 98.80% | $118.40 |
| MISERY | $572,850.25 | 4,839 | 58.78% | $118.38 |
| NOISES OFF | $285,682.20 | 4,208 | 81.24% | $67.89 |
| ON YOUR FEET! | $1,239,108.70 | 10,518 | 80.86% | $117.81 |
| SCHOOL OF ROCK | $1,506,236.20 | 11,630 | 101.80% | $129.51 |
| SOMETHING ROTTEN! | $1,005,546.00 | 9,120 | 68.39% | $110.26 |
| SPRING AWAKENING | $467,252.50 | 5,614 | 78.17% | $83.23 |
| SYLVIA | $271,394.50 | 5,133 | 68.47% | $52.87 |
| THE BOOK OF MORMON | $1,891,355.63 | 8,747 | 102.57% | $216.23 |
| THE COLOR PURPLE | $1,008,774.20 | 8,291 | 98.61% | $121.67 |
| THE CURIOUS INCIDENT OF THE DOG IN THE NIGHT-TIME | $792,020.25 | 7,596 | 93.27% | $104.27 |
| THE GIN GAME | $250,913.77 | 4,418 | 68.86% | $56.79 |
| THE ILLUSIONISTS – LIVE ON BROADWAY | $1,362,680.50 | 11,979 | 86.62% | $113.76 |
| THE KING AND I | $1,094,022.00 | 7,464 | 89.11% | $146.57 |
| THE LION KING | $2,588,075.00 | 13,570 | 100.01% | $190.72 |
| THE PHANTOM OF THE OPERA | $1,458,784.11 | 12,350 | 96.18% | $118.12 |
| THÉRÈSE RAQUIN | $288,231.00 | 4,205 | 58.95% | $68.54 |
| WICKED | $2,400,920.00 | 14,798 | 99.10% | $162.25 |
| Totals | $36,271,797.36 | 299,280 | 82.35% | $112.24 |
Broadway ticket sales raw data are provided courtesy of The Broadway League All other data, text, opinion, charts and commentary are copyright © 2015 nytix.com