By Jennifer R Jones | Posted on November 10, 2015 6:20 PM
The Week Ending November 8, 2015 Was A Big Boost For Ticket Sales On Broadway, Only China Doll Saw A Significant Decrease, Lord Of The Dance Began Previews To Moderate Box Office
This Week’s Notable Movements on Broadway are:
New Show: “Lord of the Dance: Dangerous Games”
On November 7, 2015, Lord of the Dance: Dangerous Games began previews at Broadway’s Lyric Theatre. After four previews, it will officially open tonight, November 10, 2015, and it is presently scheduled to run until January 3, 2015. A dance show created, directed, and choreographed by Michael Flatley, this show ambitiously settled into the enormous Lyric Theatre, previously the Foxwoods among other names, which has been home to ill-fated shows aiming to live up to the theatre’s gigantic potential such as Spiderman: Turn Off the Dark, and more recently On the Town.
In its first partial week of four performances, it brought in $231,662, which represents just 30.2% of the gross potential of $767,928. With a top ticket price of $225.00, the average paid admission was $52.25, and the average audience capacity was 58.5%. This is not terrible for the first few preview performances of a new show, and yet with such big shoes to fill in the Lyric Theatre, the show did not live up to its gross potential. Perhaps the reviews may give a boost to this show, which is an unusual genre of fare for Broadway.
A Huge Boost to Box Office this Week on Broadway
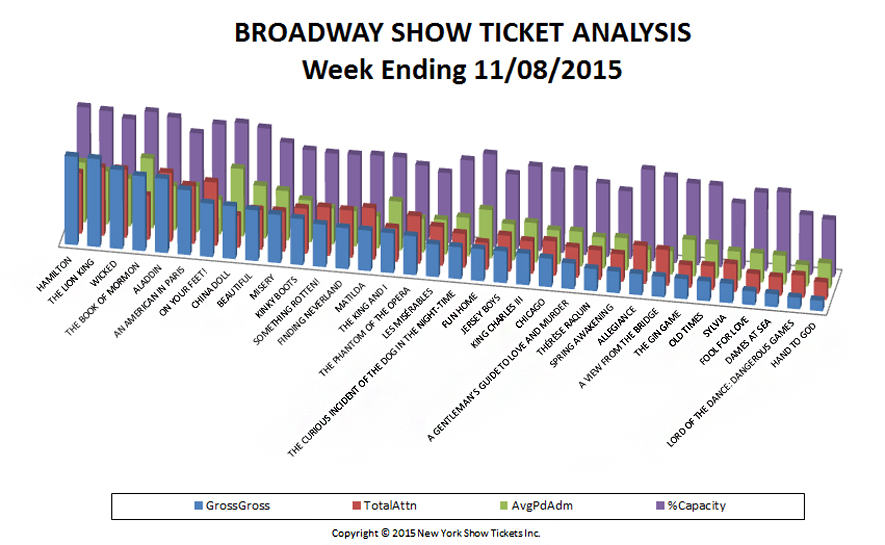
In the week ending November 8, 2015, Broadway experienced a collective gross of $26,640,595 across the 34 shows currently running. With just one more show running this week than last week, the overall box office gross increased by 16.74%, and the average paid admission increased from $95.04 last week to $100.69 this week. Furthermore, the number of tickets sold increased from 240,104 last week to 264,573 this week. This biggest increase was seen by Matilda, which brought in $811,640, an increase of $255,675 from the week before. Just behind was Aladdin, which rose by $242,418 to reach a weekly gross of $1,486,244, followed by Kinky Boots which increased by $238,210 to reach a weekly gross of $925,105.
In addition, Wicked increased by $237,223 to reach a weekly gross of $1,583,873, King Charles III saw a huge boost post opening of $219,743 to reach a weekly gross of $625,434, still only 62.7% of its gross potential, and The King and I increased by $185,400 to reach a weekly gross of $800,387. Six figure increases were seen by many more shows, including An American in Paris, Hamilton, Something Rotten!, Les Miserables, Finding Neverland, Beautiful, Spring Awakening, The Lion King, On Your Feet!, The Book of Mormon, Dames at Sea, and A Gentleman’s Guide to Love and Murder. Only three shows saw a decrease in ticket sales: China Doll with its negative buzz saw a decrease of $158,373, to reach a weekly gross of $1,057,508, and both Fool for Love and Allegiance saw five figure decreases as well.
The Following are the Broadway Ticket Sales Numbers For the Week Ending November 8, 2015:
| Show Name | GrossGross | TotalAttn | %Capacity | AvgPdAdm |
| A GENTLEMAN’S GUIDE TO LOVE AND MURDER | $511,653 | 6,007 | 82.79% | $85.18 |
| A VIEW FROM THE BRIDGE | $406,719 | 7,103 | 84.00% | $57.26 |
| ALADDIN | $1,486,244 | 13,680 | 99.02% | $108.64 |
| ALLEGIANCE | $420,978 | 7,529 | 89.04% | $55.91 |
| AN AMERICAN IN PARIS | $1,300,298 | 11,505 | 85.65% | $113.02 |
| BEAUTIFUL | $1,016,469 | 7,904 | 96.30% | $128.60 |
| CHICAGO | $572,096 | 6,859 | 79.39% | $83.41 |
| CHINA DOLL | $1,057,508 | 6,373 | 99.36% | $165.94 |
| DAMES AT SEA | $258,915 | 3,677 | 78.84% | $70.41 |
| FINDING NEVERLAND | $819,351 | 9,409 | 78.20% | $87.08 |
| FOOL FOR LOVE | $276,741 | 3,912 | 76.53% | $70.74 |
| FUN HOME | $638,172 | 5,359 | 90.52% | $119.08 |
| HAMILTON | $1,772,253 | 12,050 | 101.35% | $147.07 |
| HAND TO GOD | $210,937 | 3,455 | 55.94% | $61.05 |
| JERSEY BOYS | $636,186 | 7,157 | 72.85% | $88.89 |
| KING CHARLES III | $625,434 | 6,455 | 82.59% | $96.89 |
| KINKY BOOTS | $925,105 | 8,977 | 78.80% | $103.05 |
| LES MISÉRABLES | $652,409 | 7,705 | 68.36% | $84.67 |
| LORD OF THE DANCE: DANGEROUS GAMES | $231,662 | 4,434 | 58.47% | $52.25 |
| MATILDA | $811,640 | 10,250 | 79.53% | $79.18 |
| MISERY | $967,742 | 7,966 | 84.24% | $121.48 |
| OLD TIMES | $392,201 | 4,707 | 79.51% | $83.32 |
| ON YOUR FEET! | $1,070,197 | 12,609 | 96.22% | $84.88 |
| SOMETHING ROTTEN! | $849,853 | 9,587 | 77.58% | $88.65 |
| SPRING AWAKENING | $430,986 | 5,436 | 66.23% | $79.28 |
| SYLVIA | $387,731 | 5,485 | 64.02% | $70.69 |
| THE BOOK OF MORMON | $1,500,520 | 8,748 | 102.58% | $171.53 |
| THE CURIOUS INCIDENT OF THE DOG IN THE NIGHT-TIME | $640,274 | 6,739 | 82.75% | $95.01 |
| THE GIN GAME | $400,232 | 4,466 | 79.55% | $89.62 |
| THE KING AND I | $800,387 | 6,678 | 79.73% | $119.85 |
| THE LION KING | $1,764,832 | 13,534 | 99.75% | $130.40 |
| THE PHANTOM OF THE OPERA | $778,945 | 9,451 | 73.61% | $82.42 |
| THÉRÈSE RAQUIN | $442,052 | 5,827 | 71.48% | $75.86 |
| WICKED | $1,583,873 | 13,540 | 93.66% | $116.98 |
| Totals | $26,640,593 | 264,573 | 82.01% | $96.13 |
Broadway ticket sales raw data are provided courtesy of The Broadway League All other data, text, opinion, charts and commentary are copyright © 2015 nytix.com