By Jennifer R Jones | Posted on November 02, 2015 5:37 PM
In The Week Ending November 1, 2015, Most Broadway Shows Saw A Decrease In Ticket Sales, Only Hamilton Continues To Outshine Them All And Saw An Increase To Reach Its Third Highest Gross Yet
This Week’s Notable Movements on Broadway are:
“Hamilton” Continues to Bring In Extraordinarily Strong Grosses
In the week ending November 1, 2015, only one show performed positively, and that show did so to an unbelievable extent. Hamilton, which has amazed audiences and critics since beginning Broadway previews on July 13, 2015, just brought in almost its highest weekly gross yet. This past week, the musical brought in $1,595,089, which represents 119.49% of its gross potential. With a top ticket price of $475.00, the average paid admission was $148.71, and the weekly gross this week was an increase of $105,856 from the week before.
This occurred in a week when every single other show on Broadway saw a decrease in ticket sales, with the exception of three shows that were playing their first full performance week, with the extra performances accounting for the increase in sales. Other than Hamilton, no other show brought in more this week per performance than it did the week before. This is the third highest grossing week in the Broadway history of Hamilton; the highest grossing week was the week ending September 6, 2015, with a gross of $1,697,070 or 127.13% of its gross potential, and the second highest week was the week ending October 11, 2015, with a weekly gross of $1,678,091 or 125.70% of its gross potential.
A Major Downturn on Broadway This Week
Other than Hamilton, no other show demonstrated an increase in ticket sales on a per performance basis. Across the 33 shows currently running, only four saw increases in ticket sales, but Hamilton was the only one that did not increase the number of performances from the week before. The other three – Misery, China Doll, and A View from the Bridge – all began performances last week and the additional performances account for the only reason they saw an increase in ticket sales this week. In sum, the entire industry saw a collective decrease of $4,095,509 with respective to last week. It is difficult to attest to why there was such a significant decrease this past week.
The biggest decrease was seen by Something Rotten! which went down by $312,294 to reach the weekly gross of $673,844. Further decreases were seen by Kinky Boots, which went down by $294,540 to reach $686,895, An American in Paris, which went down by $293,463 to reach a weekly gross of $1,122,825, Wicked, which went down by $274,407 to reach a weekly gross of $1,346,650, Les Miserables, which went down by $263,226 to reach a weekly gross of $480,903, The Lion King, which went down by $261,244 to reach a weekly gross of $1,640,663, The King and I, which went down by $260,920 to reach a weekly gross of $614,987, Aladdin, which went down by $256,973 to reach a weekly gross of $1,243,826, Matilda, which went down by $212,433 to reach a weekly gross of $555,965, and Beautiful, which went down by $203,069 to reach a weekly gross of $872,132. Therefore, the shows that decreased by over $200,000 from last week were a mixture of major hits for whom the decrease was not terribly significant, and long-running shows for whom the decrease was a major blow.
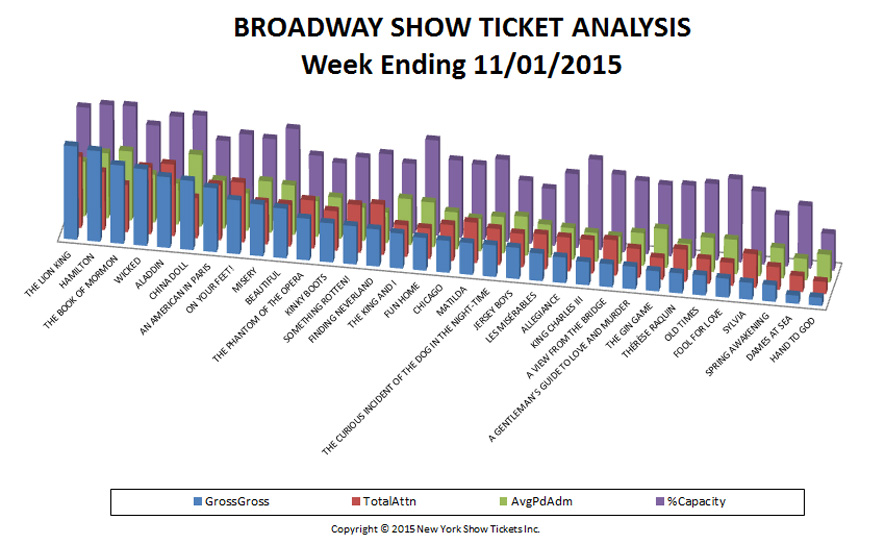
The Following are the Broadway Ticket Sales Numbers for the Week Ending November 1, 2015:
| Show Name | GrossGross | TotalAttn | %Capacity | AvgPdAdm |
| A GENTLEMAN’S GUIDE TO LOVE AND MURDER | $395,900 | 5,291 | 72.92% | $74.83 |
| A VIEW FROM THE BRIDGE | $403,408 | 6,520 | 77.11% | $61.87 |
| ALADDIN | $1,243,826 | 13,274 | 96.08% | $93.70 |
| ALLEGIANCE | $449,953 | 6,250 | 73.91% | $71.99 |
| AN AMERICAN IN PARIS | $1,122,825 | 10,211 | 76.02% | $109.96 |
| BEAUTIFUL | $872,132 | 7,725 | 94.12% | $112.90 |
| CHICAGO | $561,186 | 6,655 | 77.03% | $84.33 |
| CHINA DOLL | $1,215,881 | 7,423 | 99.20% | $163.80 |
| DAMES AT SEA | $143,007 | 2,918 | 62.56% | $49.01 |
| FINDING NEVERLAND | $652,542 | 9,285 | 77.17% | $70.28 |
| FOOL FOR LOVE | $332,883 | 4,246 | 83.06% | $78.40 |
| FUN HOME | $576,307 | 5,633 | 95.15% | $102.31 |
| HAMILTON | $1,595,089 | 10,726 | 101.50% | $148.71 |
| HAND TO GOD | $142,966 | 2,262 | 36.63% | $63.20 |
| JERSEY BOYS | $547,207 | 6,173 | 62.84% | $88.65 |
| KING CHARLES III | $405,691 | 6,168 | 90.19% | $65.77 |
| KINKY BOOTS | $686,895 | 7,288 | 63.97% | $94.25 |
| LES MISÉRABLES | $480,903 | 6,413 | 56.89% | $74.99 |
| MATILDA | $555,965 | 7,486 | 74.68% | $74.27 |
| MISERY | $906,961 | 7,748 | 81.94% | $117.06 |
| OLD TIMES | $352,316 | 4,519 | 76.33% | $77.96 |
| ON YOUR FEET! | $946,680 | 11,054 | 84.36% | $85.64 |
| SOMETHING ROTTEN! | $673,844 | 8,838 | 71.52% | $76.24 |
| SPRING AWAKENING | $287,833 | 4,203 | 51.21% | $68.48 |
| SYLVIA | $295,650 | 6,243 | 72.86% | $47.36 |
| THE BOOK OF MORMON | $1,377,010 | 8,732 | 102.39% | $157.70 |
| THE CURIOUS INCIDENT OF THE DOG IN THE NIGHT-TIME | $555,354 | 6,676 | 81.97% | $83.19 |
| THE GIN GAME | $353,787 | 3,982 | 70.93% | $88.85 |
| THE KING AND I | $614,987 | 5,833 | 69.64% | $105.43 |
| THE LION KING | $1,640,663 | 13,162 | 97.01% | $124.65 |
| THE PHANTOM OF THE OPERA | $730,947 | 8,916 | 69.44% | $81.98 |
| THÉRÈSE RAQUIN | $352,583 | 5,924 | 72.67% | $59.52 |
| WICKED | $1,346,650 | 12,327 | 85.27% | $109.24 |
| Totals | $22,819,827 | 240,104 | 77.53% | $89.89 |
Broadway ticket sales raw data are provided courtesy of The Broadway League All other data, text, opinion, charts and commentary are copyright © 2015 nytix.com