By Jennifer R Jones | Posted on October 07, 2015 6:40 PM
In The Week Ending October 4, 2015 Two New Shows Premiered On Broadway: Thérèse Raquin And Sylvia, The Overall Industry Is Demonstrating An Upturn As The Fear Season Is Underway
This Week’s Notable Movements on Broadway are:
Two New Shows: “Thérèse Raquin” and “Sylvia”
In the week ending October 4, 2015, two new shows began previews on Broadway. Thérèse Raquin, starring Keira Knightley in her Broadway debut at Studio 54, brought in $227,826 across the five performances in its first partial week of previews. This represents 43.13% of the show’s gross potential, which was $528,826 over the five performances. The average paid admission was $68.52, and the average audience capacity was 65.3%. This demonstrates that audiences will need to get warmed up to the concept of this stage adaptation of an Émile Zola novel, set in 1868 France. With a name that is difficult to pronounce for American audiences, the A-list Hollywood name of Keira Knightley may not be enough to persuade ticket buyers to show up in hoards.
The show’s success may be dependent on the reviews it receives after opening on October 29, 2015. Furthermore, another show began previews this past week: the A.R. Gurney play Sylvia, which stars Matthew Broderick, Annaleigh Ashford, Robert Sella, and Julie White. In its first two performances, the show brought in $124,200, which represents 52.03% of the show’s gross potential. This is the first Broadway production of this play, though A.R. Gurney had a production of his show Love Letters last season, which did not fare very well financially despite a slew of Hollywood names involved. Nevertheless, it is too early to determine the fate of Sylvia. In its first two previews, the average paid admission was $81.12, and the average audience capacity was 71.5%.
Broadway Fall Season Underway and Grosses on the Upswing
As more and more new shows are beginning previews, the entire Broadway industry is starting to settle into its fall gear. As the weather turns a bit cooler, audiences are less eager to spend those last few sunny hours of the summer, and Broadway becomes a more attractive option. In the week ending October 4, 2015, the entire industry saw an increase of $846,108 across the 28 shows currently running. Of these, only 9 saw a decrease in ticket sales while the remaining 19 saw an increase in ticket sales from the week before. The biggest decrease was only five digits: Hamilton with a negligible decrease of $86,279, bringing it to a weekly gross of $1,481,172, which still represents 110.95% of the musical’s gross potential.
Other than the two new shows, the biggest increase was seen by The Lion King, which went up by $133,837 to reach the weekly gross of $1,892,393, representing 101.55% of the show’s gross potential. Other decreases were seen by Jersey Boys which went down by $49,956, Kinky Boots which went down by $28,035, The King and I which went down by $14,029, and Finding Neverland which went down by $10,348. All the other shows either decreased by four digits or less, or increased by five digits or less. Therefore, the overall industry stayed fairly constant this week, with a slight bend towards an improvement in ticket sales. As more shows hit the stages, this trend will hopefully continue upwards to stabilize at a healthy Broadway fall season.
The Following are the Broadway Ticket Sales Numbers for the Week Ending October 4, 2015:
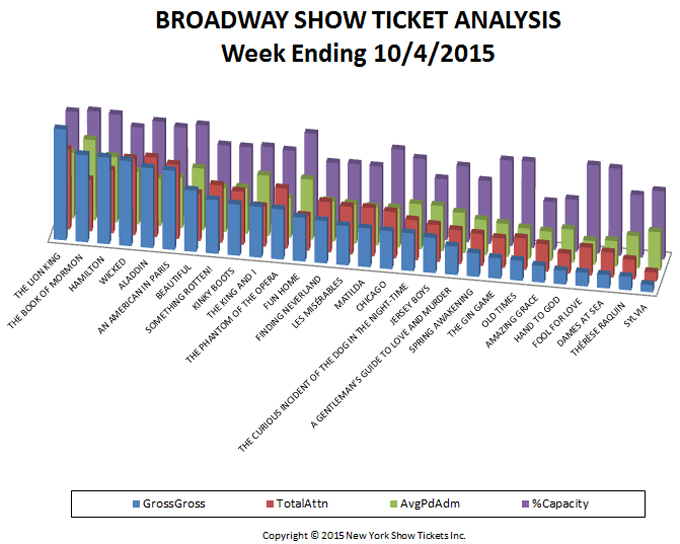
| Show Name | GrossGross | TotalAttn | %Capacity | AvgPdAdm |
| A GENTLEMAN’S GUIDE TO LOVE AND MURDER | $488,848 | 5,745 | 79.18% | $85.09 |
| ALADDIN | $1,365,965 | 13,494 | 97.67% | $101.23 |
| AMAZING GRACE | $286,205 | 4,643 | 49.95% | $61.64 |
| AN AMERICAN IN PARIS | $1,351,218 | 12,597 | 93.78% | $107.27 |
| BEAUTIFUL | $1,047,532 | 8,052 | 98.10% | $130.10 |
| CHICAGO | $647,941 | 7,848 | 90.83% | $82.56 |
| DAMES AT SEA | $229,783 | 4,245 | 91.02% | $54.13 |
| FINDING NEVERLAND | $724,795 | 8,530 | 70.89% | $84.97 |
| FOOL FOR LOVE | $236,855 | 4,725 | 92.43% | $50.13 |
| FUN HOME | $747,651 | 5,880 | 99.32% | $127.15 |
| HAMILTON | $1,481,172 | 10,705 | 101.30% | $138.36 |
| HAND TO GOD | $238,075 | 3,371 | 54.58% | $70.62 |
| JERSEY BOYS | $600,079 | 6,289 | 64.02% | $95.42 |
| KINKY BOOTS | $873,788 | 9,009 | 79.08% | $96.99 |
| LES MISÉRABLES | $671,289 | 8,080 | 71.68% | $83.08 |
| MATILDA | $662,128 | 8,175 | 71.36% | $80.99 |
| OLD TIMES | $344,384 | 5,358 | 90.51% | $64.27 |
| SOMETHING ROTTEN! | $915,993 | 9,769 | 79.05% | $93.77 |
| SPRING AWAKENING | $402,258 | 5,425 | 66.09% | $74.15 |
| SYLVIA | $124,200 | 1,531 | 71.48% | $81.12 |
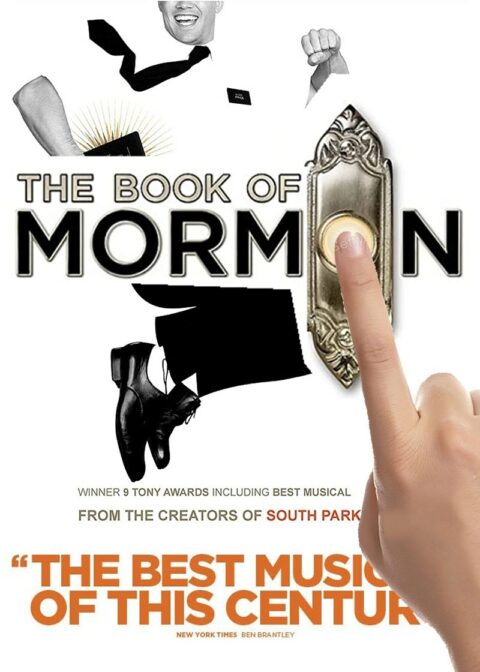
| THE BOOK OF MORMON | $1,489,412 | 8,752 | 102.63% | $170.18 |
| THE CURIOUS INCIDENT OF THE DOG IN THE NIGHT-TIME | $644,917 | 6,767 | 83.09% | $95.30 |
| THE GIN GAME | $351,748 | 5,026 | 89.53% | $69.99 |
| THE KING AND I | $868,414 | 6,814 | 81.35% | $127.45 |
| THE LION KING | $1,892,393 | 13,569 | 100.01% | $139.46 |
| THE PHANTOM OF THE OPERA | $857,083 | 10,209 | 79.51% | $83.95 |
| THÉRÈSE RAQUIN | $227,826 | 3,325 | 65.26% | $68.52 |
| WICKED | $1,454,570 | 12,969 | 89.71% | $112.16 |
| Totals | $21,226,520 | 210,902 | 82.26% | $93.93 |
Broadway ticket sales raw data are provided courtesy of The Broadway League All other data, text, opinion, charts and commentary are copyright © 2015 nytix.com