Broadway Experiences A Slow Spell As Ticket Sales Dip Across The Board. She Loves Me Concludes Performances.
Except For “Hamilton,” Broadway Continues To Slip Downward
In the week ending July 10, 2016, the majority of shows running on Broadway brought in less at the box office than they had the week before, which was also itself a slow week. Of the 29 shows currently running, only six saw an increase in ticket sales (The Humans barely increased by only $129), and 23 saw a decrease in ticket sales.
The biggest decrease was seen by Paramour, the Cirque du Soleil show at the Lyric Theatre, which brought in $859,152, which is a decrease of $141,160 from the week before. At the giant Lyric Theatre, this represents just 47.6% of its gross potential. The next biggest decrease was seen by long-running hit Chicago, which dipped by $123,507 to reach a weekly gross of $504,919, which represents just 53.4% of its gross potential.
"Wicked" Experiences Unusually Large Decrease
Following that, Wicked, despite its continual high earnings, also experienced a large decrease of $105,014, bringing it to a weekly gross of $1,758,107, or 98.8% of its gross potential. Further decreases were seen by Finding Neverland ($99,472), Beautiful ($96,449), On Your Feet! ($84,006), An American in Paris ($81,419), and The Color Purple ($74,811).
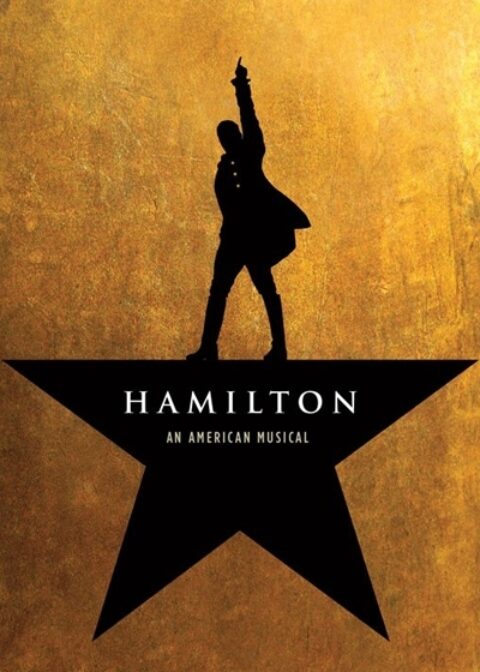
On the other hand, the largest increase was seen by unstoppable hit The Lion King (up by $91,274), which brought it to a weekly gross of $2,255,572. As for the newest mega-hit Hamilton, it increased by $30,473, bringing it to a weekly gross of $2,053,263, or 105.7% of its gross potential. At this rate, Hamilton looks poised to remain above the two million dollar mark for the duration of the summer, at least.
“She Loves Me” Sees A Boost In Its Final Week
On July 10, 2016, She Loves Me played the final performance of this most recent revival. This production began previews on February 19, 2016, and officially opened on March 17, 2016 in a Roundabout Theatre Company production at Studio 54. The show received excellent reviews, and also made history by becoming the first show to be live streamed through a partnership with BroadwayHD.
Furthermore, the show will be released on the big screen, as Screenvision Media captured several performances on tape. This is especially noteworthy for a revival, which one might not expect to be the most exciting show to experiment with new media.
Concludes As A Successful Revival
In any case, She Loves Me went out with a bang, as one of the few shows this past week to show an increase in ticket sales. In its final week of performances, She Loves Me brought in $712,072, which is an increase of $88,027 from the week before, and which represents 79.14% of its gross potential.
In fact, that is also the highest gross the show brought in throughout its entire run. With a top ticket price of $252.00, the average paid admission was $90.71, and the audience was filled up to 98.5% of its capacity. Overall, She Loves Me will be fondly remembered in the minds of those who had the pleasure to see this revival on Broadway.
The following are the Broadway ticket sales numbers for the week ending July 10, 2016:
| # | Show Name | GrossGross | TotalAttn | %Capacity | AvgPdAdm |
| 4 | ALADDIN | $1,591,362 | 13,115 | 95.00% | $121.34 |
| 29 | AN ACT OF GOD | $284,709 | 3,541 | 67.00% | $80.40 |
| 20 | AN AMERICAN IN PARIS | $618,558 | 8,230 | 61.00% | $75.16 |
| 15 | BEAUTIFUL | $709,083 | 6,593 | 80.00% | $107.55 |
| 24 | CHICAGO | $504,919 | 6,133 | 71.00% | $82.33 |
| 13 | FIDDLER ON THE ROOF | $746,147 | 9,645 | 71.00% | $77.36 |
| 21 | FINDING NEVERLAND | $563,513 | 7,589 | 63.00% | $74.25 |
| 26 | FULLY COMMITTED | $395,188 | 4,959 | 68.00% | $79.69 |
| 28 | FUN HOME | $320,261 | 4,518 | 76.00% | $70.89 |
| 2 | HAMILTON | $2,053,263 | 10,753 | 102.00% | $190.95 |
| 25 | JERSEY BOYS | $489,255 | 5,742 | 58.00% | $85.21 |
| 18 | KINKY BOOTS | $657,585 | 7,146 | 63.00% | $92.02 |
| 10 | LES MISÉRABLES | $879,952 | 10,213 | 91.00% | $86.16 |
| 8 | MATILDA | $939,097 | 10,896 | 95.00% | $86.19 |
| 17 | ON YOUR FEET! | $675,318 | 6,867 | 53.00% | $98.34 |
| 11 | PARAMOUR | $859,152 | 9,176 | 60.00% | $93.63 |
| 6 | SCHOOL OF ROCK | $1,157,594 | 11,402 | 95.00% | $101.53 |
| 14 | SHE LOVES ME | $712,072 | 7,850 | 99.00% | $90.71 |
| 12 | SHUFFLE ALONG, OR, THE MAKING OF THE MUSICAL SENSATION OF 1921 AND ALL THAT FOLLOWED | $755,787 | 7,334 | 95.00% | $103.05 |
| 19 | SOMETHING ROTTEN! | $640,454 | 7,436 | 69.00% | $86.13 |
| 5 | THE BOOK OF MORMON | $1,322,710 | 8,738 | 102.00% | $151.37 |
| 16 | THE COLOR PURPLE | $689,987 | 7,331 | 87.00% | $94.12 |
| 23 | THE CRUCIBLE | $510,250 | 6,408 | 84.00% | $79.63 |
| 27 | THE CURIOUS INCIDENT OF THE DOG IN THE NIGHT-TIME | $369,489 | 5,081 | 62.00% | $72.72 |
| 22 | THE HUMANS | $535,584 | 4,563 | 99.00% | $117.38 |
| 1 | THE LION KING | $2,255,572 | 13,185 | 97.00% | $171.07 |
| 9 | THE PHANTOM OF THE OPERA | $897,993 | 9,850 | 77.00% | $91.17 |
| 7 | WAITRESS | $969,699 | 8,020 | 96.00% | $120.91 |
| 3 | WICKED | $1,758,107 | 13,259 | 92.00% | $132.60 |
| TOTALS | $24,862,657 | 235,573 | 80.28% | $100.48 |


