By Jennifer R Jones | Posted on March 30, 2016 9:00 AM
Broadway Show Ticket Sales Analysis For Week Ending 03/27/2016. Box Office Sees Excellent Numbers As Three New Shows Begin.
Broadway Fares Excellently Over Easter Weekend
In the week ending March 27, 2016, Broadway continued to bring in excellent numbers across the board, continuing a positive streak that has lasted now for several weeks. This past week, of the 34 shows currently running, the total collective gross was $31,485,175 across the industry.
This amounts to an average gross of $926,035 per show, which is exceptional indeed, especially because the three new shows this week brought in less than a half million dollars each. In comparison to last week, which had three fewer shows running, the average went up from $859,083, demonstrating a significant increase especially in the top musicals.
"Wicked" And "The Lion King" See Big Increases
The biggest jumps were seen by the two consistent top earners: Wicked and The Lion King. Wicked brought in $2,532,613 this past week, which is an increase of $597,806 from the week before. Meanwhile, The Lion King brought in $2,629,844, which is an increase of $585,743 from the week before. Just behind these two chart-toppers is Aladdin, which brought in $2,127,857, which is an increase of $557,668 from the week before.
One of the principal reasons that these three shows performed so well is that they opted to add a ninth performance this past week, aiming to capitalize on the tourist traffic due to Easter weekend. All were successful, but of these three only Wicked brought in more than 100% of its gross potential, amounting to 126.5%. Hamilton also continued to perform well to its scale, bringing in $1,719,570 this past week, which represents 128.8% of its gross potential.
Three New Shows: “The Father,” “American Psycho,” “Waitress”
This past week, three new shows began previews for the spring season. First, on March 22, 2016, The Father began previews in a Manhattan Theatre Club production. Playing seven performances in its first week, the show brought in only $163,744, which represents just 26.4% of its gross potential.
Although it stars Frank Langella and received rave reviews in Europe, The Father is tough sell on Broadway amidst all the other glitzy options. Then, on March 24, 2016, American Psycho began previews at the Gerald Schoenfeld Theatre. Leveraging its brand name from the successful film and novel that preceded it, American Psycho began its Broadway run with moderate promise. In its first partial week of four performances, the musical brought in $365,186, representing 68.9% of its gross potential.
"Waitress" Demonstrates Financial Promise
With a top ticket price of $248.00, the average paid admission was $90.04, and the audience was filled up to an average capacity of 98.4%. Therefore, at least right out of the gate, audiences did demonstrate interest in American Psycho, but reviewers will cinch whether the musical has legs further into its run.
Finally, on March 25, 2015, the new musical Waitress began previews at the Brooks Atkinson Theatre. With an all-female creative team, music, and lyrics by five-time Grammy nominee Sara Bareilles, and starring Jessie Mueller (Beautiful: The Carole King Musical), Waitress is demonstrating financial promise.
"Wicked", "Hamilton", And "The Book Of Mormon" Exceed Gross Potential
In its first partial week of just three performances, the show brought in $425,830, which represents an astonishing 111.4% of its gross potential. The only other shows this past week that exceeded their gross potentials were Wicked, Hamilton, and The Book of Mormon, so Waitress appears to be in good company.
With a top ticket price of $270.00, Waitress had an average paid admission of $134.29, and the audience was filled up to an average capacity of 101.1%.
The following are the Broadway ticket sales numbers for the week ending March 27, 2016: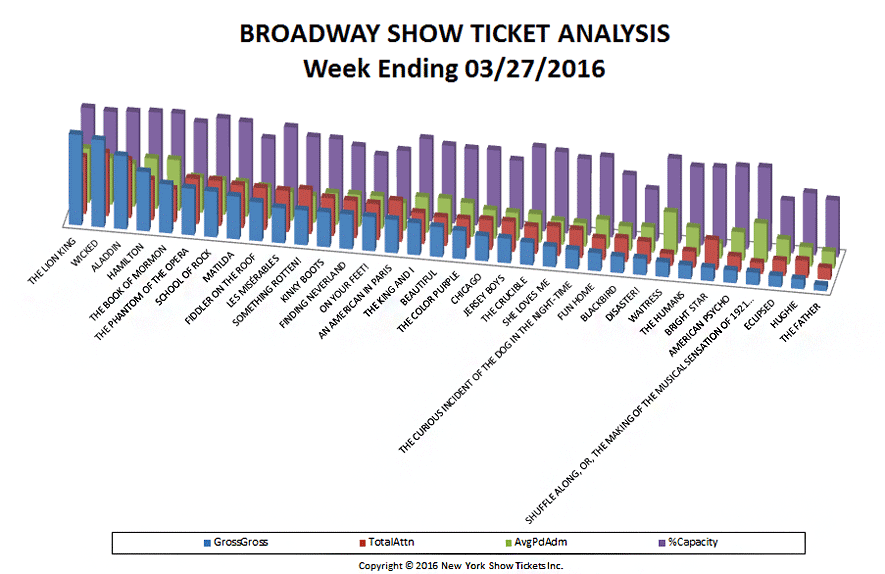
| # | Show Name | GrossGross | TotalAttn | %Capacity | AvgPdAdm |
| 3 | ALADDIN | $2,127,857 | 15,519 | 99.85% | $137.11 |
| 31 | AMERICAN PSYCHO | $365,186 | 4,056 | 98.35% | $90.04 |
| 16 | AN AMERICAN IN PARIS | $968,216 | 11,012 | 81.98% | $87.92 |
| 18 | BEAUTIFUL | $872,074 | 7,628 | 92.93% | $114.33 |
| 26 | BLACKBIRD | $475,196 | 6,223 | 76.71% | $76.36 |
| 30 | BRIGHT STAR | $384,716 | 7,969 | 95.05% | $48.28 |
| 20 | CHICAGO | $723,791 | 7,974 | 92.29% | $90.77 |
| 27 | DISASTER! | $473,885 | 5,898 | 61.54% | $80.35 |
| 33 | ECLIPSED | $318,920 | 4,027 | 62.76% | $79.20 |
| 10 | FIDDLER ON THE ROOF | $1,126,634 | 11,201 | 82.02% | $100.58 |
| 14 | FINDING NEVERLAND | $1,009,392 | 9,916 | 82.41% | $101.79 |
| 25 | FUN HOME | $520,363 | 5,672 | 95.81% | $91.74 |
| 4 | HAMILTON | $1,719,570 | 10,755 | 101.77% | $159.89 |
| 34 | HUGHIE | $278,658 | 4,583 | 74.21% | $60.80 |
| 21 | JERSEY BOYS | $713,574 | 8,066 | 82.11% | $88.47 |
| 13 | KINKY BOOTS | $1,009,623 | 10,100 | 88.66% | $99.96 |
| 11 | LES MISÉRABLES | $1,015,672 | 11,052 | 98.05% | $91.90 |
| 8 | MATILDA | $1,237,341 | 11,393 | 99.45% | $108.61 |
| 15 | ON YOUR FEET! | $992,096 | 9,607 | 73.85% | $103.27 |
| 7 | SCHOOL OF ROCK | $1,323,673 | 12,130 | 101.42% | $109.12 |
| 23 | SHE LOVES ME | $590,842 | 7,830 | 97.10% | $75.46 |
| 32 | SHUFFLE ALONG, OR, THE MAKING OF THE MUSICAL SENSATION OF 1921 AND ALL THAT FOLLOWED | $358,845 | 2,889 | 100.00% | $124.21 |
| 12 | SOMETHING ROTTEN! | $1,011,004 | 11,842 | 88.80% | $85.37 |
| 5 | THE BOOK OF MORMON | $1,414,631 | 8,751 | 102.61% | $161.65 |
| 19 | THE COLOR PURPLE | $819,292 | 7,668 | 91.20% | $106.85 |
| 22 | THE CRUCIBLE | $651,186 | 7,233 | 100.24% | $90.03 |
| 24 | THE CURIOUS INCIDENT OF THE DOG IN THE NIGHT-TIME | $554,597 | 7,430 | 91.23% | $74.64 |
| 35 | THE FATHER | $163,744 | 3,094 | 68.00% | $52.92 |
| 29 | THE HUMANS | $395,820 | 4,306 | 93.45% | $91.92 |
| 17 | THE KING AND I | $928,304 | 8,252 | 98.52% | $112.49 |
| 1 | THE LION KING | $2,629,844 | 15,236 | 99.82% | $172.61 |
| 6 | THE PHANTOM OF THE OPERA | $1,352,186 | 12,085 | 94.12% | $111.89 |
| 28 | WAITRESS | $425,830 | 3,171 | 101.15% | $134.29 |
| 2 | WICKED | $2,532,613 | 16,940 | 97.73% | $149.50 |
| Totals | $31,485,172 | 291,508 | 90.15% | $101.89 |