By Jennifer R Jones | Posted on July 21, 2015 11:24 AM
In The Week Ending July 19, 2015, Broadway Saw An Overall Increase Of Over Three Million Dollars. Partly Due To Hamilton’s First Week.
Right Away, “Hamilton” Is A Run-Away Hit
In the week ending July 19, 2015, Hamilton began previews at the Richard Rodgers Theatre on Broadway. After playing a highly acclaimed run Off-Broadway at the Public Theater, it transferred with its first preview on July 13, 2015. Though it only played seven performances in its first week, rather than the usual 8, it brought in a weekly gross of $1,288,436.
That represents 110.30% of its gross potential, and the average audience was filled up to 100.3%. With a top ticket price of $275.00, the average paid admission was $138.94. This is an extremely good achievement for a musical in its first week of previews, especially one that opened in the height of summer without the Tony Award buzz to boost it forward.
"Fun Home" Wins Tony Before "Hamilton" Premieres
Hamilton has been highly buzzed for many months, and there were even talks about bringing it to Broadway before the Tony Awards this year, but the creative team decided to wait until July in order to finely tune the piece. Furthermore, this allowed the Public Theater’s other masterpiece, Fun Home, to win Best Musical without competition from Hamilton, and now Hamilton will certainly be in the running for that award next year.
This show is Lin Manuel-Miranda’s newest concoction, following his success with In the Heights, although this show is more controversial, and also more enticing, due to its reimagining of an important historical figure.
An Overall Excellent Week On Broadway
Including the $1,288,436 that Hamilton brought to the table in its first week of previews, the week ending July 19, 2015 saw an overall increase in ticket sales of $3,458,042 from the week before. Of the 29 shows currently running, 27 of them saw an increase in ticket sales, and only two decreased by a small amount.
Following Hamilton’s powerful entrance onto the scene, the next biggest increase in ticket sales was seen by The Lion King, which brought in $311,125 more than the week before to reach a gross of $2,620,016, Wicked, which brought in $267,724 more than the week before to reach a gross of $2,167,815, and The Book of Mormon, which brought in $203,287 more than the week before to reach a gross of $1,654,152.
Hit Musicals Add Extra Performances
Also, all three of these hit musicals played 9 performances this past week, up from the usual 8 which they played last week. Furthermore, Penn & Teller on Broadway continued to creep up in box office, bringing in $1,225,440 which is an increase of $150,111 from the week before.
Other six figure increases were seen by The Phantom of the Opera, Hedwig and the Angry Inch, Les Miserables, Beautiful, and On the Twentieth Century. Though On the Twentieth Century had been performing fairly poorly, it played its final performance on July 19, 2015, and this announcement of the final week was enough to bring the last week’s gross up by six figures to $571,895.
The following are the Broadway ticket sales numbers for the week ending July 19, 2015: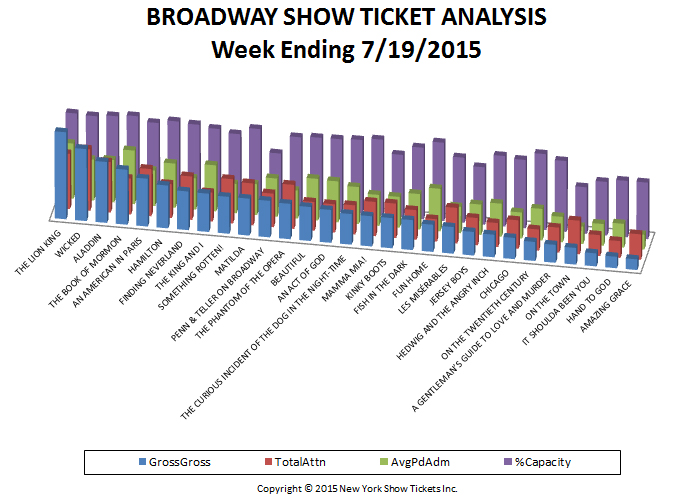
| Show Name | GrossGross | TotalAttn | %Capacity | AvgPdAdm |
| A GENTLEMAN’S GUIDE TO LOVE AND MURDER | $538,813 | 6,783 | 93.48% | $79.44 |
| ALADDIN | $1,833,662 | 13,818 | 100.01% | $132.70 |
| AMAZING GRACE | $321,914 | 6,933 | 74.58% | $46.43 |
| AN ACT OF GOD | $990,023 | 7,713 | 95.84% | $128.36 |
| AN AMERICAN IN PARIS | $1,439,179 | 12,878 | 95.88% | $111.75 |
| BEAUTIFUL | $1,023,705 | 7,835 | 95.46% | $130.66 |
| CHICAGO | $638,796 | 7,791 | 90.17% | $81.99 |
| FINDING NEVERLAND | $1,164,664 | 11,844 | 98.44% | $98.33 |
| FISH IN THE DARK | $902,194 | 8,099 | 94.35% | $111.40 |
| FUN HOME | $817,665 | 6,120 | 103.38% | $133.61 |
| HAMILTON | $1,288,436 | 9,273 | 100.28% | $138.94 |
| HAND TO GOD | $344,030 | 4,598 | 74.45% | $74.82 |
| HEDWIG AND THE ANGRY INCH | $681,087 | 6,552 | 92.95% | $103.95 |
| IT SHOULDA BEEN YOU | $392,500 | 5,725 | 70.71% | $68.56 |
| JERSEY BOYS | $709,588 | 7,430 | 75.63% | $95.50 |
| KINKY BOOTS | $909,402 | 9,393 | 82.45% | $96.82 |
| LES MISÉRABLES | $801,902 | 9,692 | 85.98% | $82.74 |
| MAMMA MIA! | $909,862 | 9,342 | 100.15% | $97.39 |
| MATILDA | $1,110,520 | 11,439 | 99.85% | $97.08 |
| ON THE TOWN | $501,525 | 9,178 | 61.22% | $54.64 |
| ON THE TWENTIETH CENTURY | $571,895 | 5,788 | 100.21% | $98.81 |
| PENN & TELLER ON BROADWAY | $1,100,653 | 9,144 | 69.95% | $120.37 |
| SOMETHING ROTTEN! | $1,111,321 | 12,095 | 90.69% | $91.88 |
| THE BOOK OF MORMON | $1,654,152 | 9,828 | 102.44% | $168.31 |
| THE CURIOUS INCIDENT OF THE DOG IN THE NIGHT-TIME | $920,865 | 7,923 | 97.29% | $116.23 |
| THE KING AND I | $1,152,974 | 7,971 | 95.16% | $144.65 |
| THE LION KING | $2,620,016 | 15,100 | 98.93% | $173.51 |
| THE PHANTOM OF THE OPERA | $1,064,460 | 12,031 | 93.70% | $88.48 |
| WICKED | $2,167,815 | 16,815 | 97.67% | $128.92 |
| Total | $29,683,617 | 269,131 | 90.73% | $106.77 |