By Jennifer R Jones | Posted on November 30, 2015 4:53 PM
This Past Week The Entire Broadway Industry Saw A Massive Leap Of Almost $7 Million, However Certain Shows Are Finding It Difficult To Keep Up Including Lord Of The Dance Dangerous Games
This Week’s Notable Movements on Broadway are:
Thanksgiving Holiday Results in Healthy Ticket Sales on Broadway
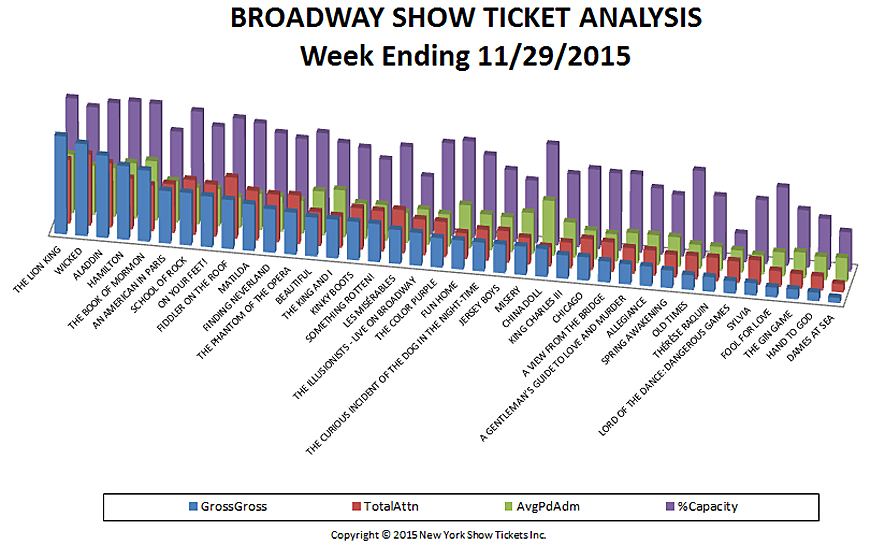
In the week ending November 29, 2015, the entire Broadway industry had 38 shows running, the total gross of which amounted to $33,851,356. This represents an average gross per show of $890,825, and is an increase of $6,910,729 from the week before. The overall average paid admission was $117.53, with an average top ticket price of $249.12. Of the 38 shows running, 28 saw an increase in sales, and 10 saw a decrease in sales. However, the increases were much more significant than the decreases. For example, the biggest increase was seen by Wicked, which opted to include 9 performances in this holiday week comprising Thanksgiving, and which increased by $782,716 from the week before.
Fiddler on the Roof brought in an excellent gross of $1,221,716, including an increase of $731,657 from last week’s partial week of performances. The Lion King went up by $723,998 to reach the phenomenal gross of $2,436,498. Aladdin went up by $699,501 to reach a weekly gross of $2,048,348, and School of Rock played its first full week of performances, entailing an increase of $567,539 to reach a weekly gross of $1,304,251. In total, 20 individual shows saw an increase of six figures this past week, resulting in an overall very healthy week.
“Lord of the Dance: Dangerous Games” Among Dangerously Low Grossing Shows
This past week, the honor of lowest percentage reached of gross potential went to Lord of the Dance: Dangerous Games, Michael Flatley’s Irish dancing show in the enormous Lyric Theatre. With a weekly gross of just $311,737, the show has the supposed potential to sell tickets amounting to a gross of $1,685,588. The Lyric Theatre is notoriously difficult to fill up due to its gigantic size, but previous shows such as Spiderman: Turn Off the Dark, and even On the Town, did a better job than Lord of the Dance is presently doing in this venue. This represents just 18.5% of the show’s gross potential, even with an additional performance this week bringing the total to 9 shows that week.
While Lord of the Dance brought in the lowest percentage of its gross potential, there were five shows that brought in less in terms of weekly gross. Dames at Sea, which recently announced its premature closing in early January, only brought in $127,199 this past week of eight performances, representing just 22.8% of its gross potential. This is an increase of the negligible amount of $128 from the week before. Even in the small Helen Hayes Theatre, the audience was notoriously sparse at an average of 37.3% capacity this past week.
Other Shows are Facing a Box Office Decrease
Hand to God, which made a big splash last year before Tony Awards season, is also on its last legs. This past week, it brought in only $211,795, representing just 33.7% of its gross potential. Additional low grosses were seen by The Gin Game with $241,917, Fool for Love with $245,366, and Sylvia with $306,496. These shows will likely be among the easiest to secure discounts tickets to in this holiday season.
The Following are the Broadway Ticket Sales Numbers for the Week Ending November 29, 2015:
| Show Name | GrossGross | TotalAttn | %Capacity | AvgPdAdm |
| A GENTLEMAN’S GUIDE TO LOVE AND MURDER | $499,556 | 5,427 | 74.79% | $92.05 |
| A VIEW FROM THE BRIDGE | $523,447 | 6,266 | 74.10% | $83.54 |
| ALADDIN | $2,048,348 | 13,633 | 98.68% | $150.25 |
| ALLEGIANCE | $490,878 | 5,340 | 63.15% | $91.92 |
| AN AMERICAN IN PARIS | $1,305,329 | 10,305 | 76.72% | $126.67 |
| BEAUTIFUL | $970,795 | 7,188 | 87.57% | $135.06 |
| CHICAGO | $582,301 | 6,559 | 75.91% | $88.78 |
| CHINA DOLL | $693,200 | 4,105 | 96.00% | $168.87 |
| DAMES AT SEA | $127,199 | 1,742 | 37.35% | $73.02 |
| FIDDLER ON THE ROOF | $1,221,716 | 12,898 | 94.45% | $94.72 |
| FINDING NEVERLAND | $1,082,122 | 10,094 | 83.89% | $107.20 |
| FOOL FOR LOVE | $245,366 | 3,341 | 74.69% | $73.44 |
| FUN HOME | $724,240 | 5,467 | 92.35% | $132.47 |
| HAMILTON | $1,833,886 | 10,739 | 101.62% | $170.77 |
| HAND TO GOD | $211,795 | 2,987 | 48.36% | $70.91 |
| JERSEY BOYS | $715,382 | 6,699 | 68.19% | $106.79 |
| KING CHARLES III | $584,950 | 5,428 | 69.45% | $107.77 |
| KINKY BOOTS | $954,445 | 8,768 | 76.97% | $108.86 |
| LES MISÉRABLES | $847,062 | 9,191 | 81.54% | $92.16 |
| LORD OF THE DANCE: DANGEROUS GAMES | $311,737 | 4,593 | 26.92% | $67.87 |
| MATILDA | $1,158,878 | 10,485 | 91.52% | $110.53 |
| MISERY | $711,371 | 5,646 | 60.01% | $126.00 |
| OLD TIMES | $365,051 | 4,944 | 83.51% | $73.84 |
| ON YOUR FEET! | $1,261,413 | 11,035 | 84.83% | $114.31 |
| SCHOOL OF ROCK | $1,304,251 | 11,604 | 97.61% | $112.40 |
| SOMETHING ROTTEN! | $947,391 | 8,564 | 67.52% | $110.62 |
| SPRING AWAKENING | $438,374 | 4,807 | 58.56% | $91.19 |
| SYLVIA | $306,496 | 5,208 | 60.78% | $58.85 |
| THE BOOK OF MORMON | $1,771,091 | 9,717 | 101.28% | $182.27 |
| THE COLOR PURPLE | $736,425 | 7,451 | 88.62% | $98.84 |
| THE CURIOUS INCIDENT OF THE DOG IN THE NIGHT-TIME | $716,314 | 6,557 | 80.51% | $109.24 |
| THE GIN GAME | $241,917 | 3,073 | 54.74% | $78.72 |
| THE ILLUSIONISTS – LIVE ON BROADWAY | $816,110 | 7,576 | 54.78% | $107.72 |
| THE KING AND I | $966,143 | 6,687 | 79.84% | $144.48 |
| THE LION KING | $2,436,498 | 13,512 | 99.59% | $180.32 |
| THE PHANTOM OF THE OPERA | $1,045,645 | 10,318 | 80.36% | $101.34 |
| THÉRÈSE RAQUIN | $363,361 | 4,965 | 60.91% | $73.18 |
| WICKED | $2,290,873 | 15,099 | 92.84% | $151.72 |
| Totals | $33,851,352 | 288,018 | 76.33% | $109.70 |
Broadway ticket sales raw data are provided courtesy of The Broadway League All other data, text, opinion, charts and commentary are copyright © 2015 nytix.com