By Jennifer R Jones | Posted on December 07, 2015 2:40 PM
Broadway Saw A Decrease In Ticket Sales That Was Quite Significant, The Biggest Increase Was Seen By China Doll Due To Its Added Performances, The Biggest Decrease Was Seen By School Of Rock
This Week’s Notable Movements on Broadway are:
A Slump Week on Broadway
In the week ending December 6, 2015, the Broadway industry as a whole showed a significant decrease from the week before. This comparison is made more drastic by the fact that the previous week included the Thanksgiving holiday, when the industry saw a major jump due to school breaks and family vacations over that period. However, this past week, the entire industry of 37 presently running shows saw a decrease of $3,851,630 compared to the week before, and the average gross per show this past week was $800,937, as opposed to an average per show of $905,035 the previous week for those same shows.
The average percentage reached of gross potential across the running shows was 63.51%, and the average audience capacity was 75.02%. Of these 37 shows, 12 saw an increase in sales, and 25 saw a decrease in sales. The biggest increase was seen by China Doll, the new David Mamet play starring Al Pacino, which has been widely reported to be overrated. Nevertheless, the show saw an increase of $416,762 from the week before, due merely to the face that the previous week had only 4 performances, and this week was back up to the full 7. Despite reports of disappointing quality, this show still managed to bring in 100.03% of its gross potential, due to the star power of its cast and creative team.
Andrew Lloyd Webber’s “School of Rock” Saw Major Decrease Before Opening
School of Rock – the Musical is Andrew Lloyd Webber’s newest musical, an adaptation of the popular film of the same name starring Jack Black. Though it may seem a surprising choice for devotees of the classical musical theatre canon, of which Webber is a major part, the show still began previews with significant buzz and performed quite well at the box office during the first few weeks of its performances. However, prior to its opening night performance on December 6, 2015, the show saw a steep decrease in ticket sales. This past week, it brought in $669,028, which is a decrease of $635,223 from the week before – the biggest decrease of any show on Broadway this past week, when 25 shows saw a decrease.
With a top ticket price of $248.00, the average paid admission this past week was $63.60, whereas the previous week it had been an average of $112.40. However, the audience capacity went down much less seriously; this past week it was an average of 88.5% capacity, whereas the week before there was an average of 97.6% capacity. Therefore, a major reason for such a steep decrease in sales must be that in the week prior to opening, the producers offered a lot of complimentary tickets, mostly to press, so that they could compose their reviews to be released on the day after opening.
Broadway Show has Unusual Box Office Slump
This is indeed a common practice; however, the impact on box office is not usually so serious. Therefore, it may have been a combination of decreased interest in the show this past week, partly due to the slump following the Thanksgiving holiday, as well as the papering done by the producers to prepare for the opening night.
The Following are the Broadway Ticket Sales Numbers for the Week Ending December 6, 2015:
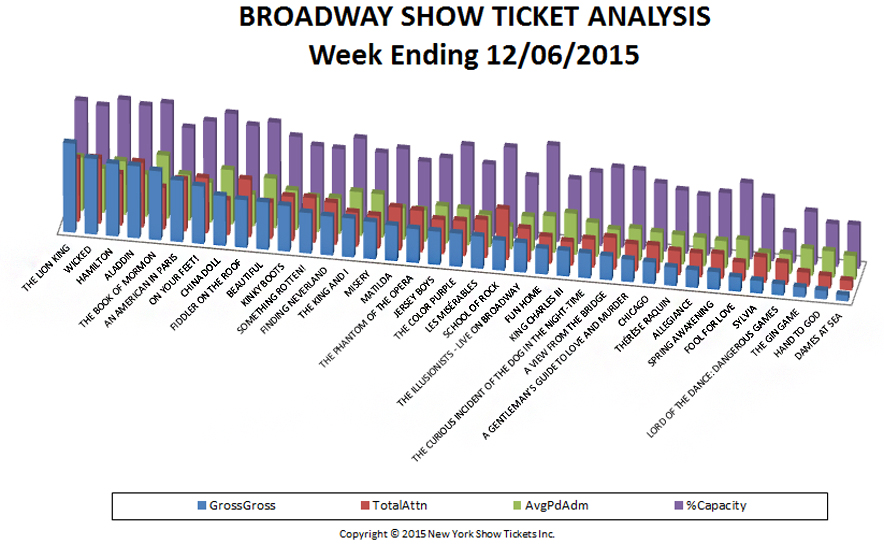
| Show Name | GrossGross | TotalAttn | %Capacity | AvgPdAdm |
| A GENTLEMAN’S GUIDE TO LOVE AND MURDER | $497,485.00 | 5,614 | 77.37% | $88.62 |
| A VIEW FROM THE BRIDGE | $533,251.10 | 6,582 | 77.84% | $81.02 |
| ALADDIN | $1,605,875.50 | 13,498 | 97.70% | $118.97 |
| ALLEGIANCE | $392,727.50 | 4,915 | 58.12% | $79.90 |
| AN AMERICAN IN PARIS | $1,369,903.60 | 10,689 | 79.58% | $128.16 |
| BEAUTIFUL | $1,054,458.70 | 7,584 | 92.40% | $139.04 |
| CHICAGO | $480,807.50 | 5,736 | 66.39% | $83.82 |
| CHINA DOLL | $1,109,962.17 | 7,275 | 97.22% | $152.57 |
| DAMES AT SEA | $131,587.50 | 1,984 | 42.54% | $66.32 |
| FIDDLER ON THE ROOF | $1,062,494.42 | 11,935 | 87.40% | $89.02 |
| FINDING NEVERLAND | $867,466.50 | 8,680 | 72.14% | $99.94 |
| FOOL FOR LOVE | $318,741.10 | 3,791 | 74.16% | $84.08 |
| FUN HOME | $571,715.40 | 5,568 | 94.05% | $102.68 |
| HAMILTON | $1,613,690.50 | 10,732 | 101.55% | $150.36 |
| HAND TO GOD | $190,204.70 | 2,573 | 41.66% | $73.92 |
| JERSEY BOYS | $741,955.60 | 7,127 | 72.55% | $104.10 |
| KING CHARLES III | $569,004.80 | 4,918 | 62.92% | $115.70 |
| KINKY BOOTS | $1,016,279.00 | 9,155 | 80.36% | $111.01 |
| LES MISÉRABLES | $717,332.50 | 7,909 | 70.17% | $90.70 |
| LORD OF THE DANCE: DANGEROUS GAMES | $247,620.50 | 4,501 | 29.67% | $55.01 |
| MATILDA | $789,026.06 | 8,902 | 77.71% | $88.63 |
| MISERY | $827,287.00 | 6,782 | 72.09% | $121.98 |
| ON YOUR FEET! | $1,283,092.50 | 11,445 | 87.98% | $112.11 |
| SCHOOL OF ROCK | $669,028.00 | 10,519 | 88.48% | $63.60 |
| SOMETHING ROTTEN! | $901,887.40 | 9,267 | 73.06% | $97.32 |
| SPRING AWAKENING | $390,738.50 | 5,149 | 62.73% | $75.89 |
| SYLVIA | $281,084.29 | 5,280 | 61.62% | $53.24 |
| THE BOOK OF MORMON | $1,536,444.74 | 8,674 | 101.71% | $177.13 |
| THE COLOR PURPLE | $738,958.10 | 7,275 | 86.52% | $101.57 |
| THE CURIOUS INCIDENT OF THE DOG IN THE NIGHT-TIME | $552,862.20 | 5,825 | 71.53% | $94.91 |
| THE GIN GAME | $218,301.09 | 2,897 | 51.60% | $75.35 |
| THE ILLUSIONISTS – LIVE ON BROADWAY | $657,333.50 | 6,837 | 61.80% | $96.14 |
| THE KING AND I | $864,141.00 | 7,044 | 84.10% | $122.68 |
| THE LION KING | $1,983,820.00 | 13,139 | 96.84% | $150.99 |
| THE PHANTOM OF THE OPERA | $754,614.60 | 8,613 | 67.08% | $87.61 |
| THÉRÈSE RAQUIN | $410,148.00 | 5,005 | 61.40% | $81.95 |
| WICKED | $1,683,339.00 | 13,544 | 93.69% | $124.29 |
| Totals | $29,634,669.57 | 276,963 | 75.02% | $101.09 |