By Jennifer R Jones | Posted on May 13, 2014 5:13 PM
Broadway Show Ticket Sales Analysis For Week Ending 05/11/214 Show Overall Increase In Sales With Cinderalla Seeing An Increase And Kinky Boots On Hiatus.
Ticket Sales Picking Up With The Warm Weather
As opposed to the previous two weeks, which showed very slow ticket sales, this past week demonstrated an increase in ticket buying for Broadway. The largest increase was the new revival of Cabaret, which was up $155,270 from the previous week, reaching an all-time weekly high of $783,761.
Furthermore, After Midnight increased by $135,410, grossing $658,463 in the week ending May 11, 2014. This show, which was nominated for the Tony Award for Best Musical, has grossed as much as $714,663 in past weeks, but this past week is the best the show has done in months. Still, that gross only took the show to 66.15% of its gross capacity.
"Cinderella" Sees An Increase In Sales
Other shows that saw an increase in sales this past week include Cinderella, which went up by $106,356, A Gentleman’s Guide to Love and Murder, which increased by $83,180, and the Daniel Radcliffe led play The Cripple of Inishmaan, which went up by $77,998.
Furthermore, The Bridges of Madison County increased by $106,038 after having announced that the show will close on May 18, 2014. There is one more week of performances for this show to recoup a little more of its investment, but it will surely close at a financial loss.
"Kinky Boots" Played Only A Half Week Of Performances
At first glance, the weekly gross of $668,658 appears to be an outrageous low for the 2013 Tony Award winning Best Musical Kinky Boots. The musical has not earned less than $1,173,857 any week of the entire year 2014 so far, and that was on a frigidly cold week in early February.
This past week, it earned $808,892 less than the week before. However, further examination of the data shows that Kinky Boots still earned 93.08% of its gross potential, as it only played 4 performances in the week ending May 11, 2014.
"Kinky Boots" Goes Dark On Broadway
The reason for this is that it decided to take a short vacation. From May 8 to May 13, 2014, the Al Hirschfield Theatre went dark, which is very unusual for a Broadway show to do during its run. The only reason this is possible is because Univision, the international television network, is utilizing the theatre for upfront presentations throughout this period.
How did they convince the Nederlander Organization, who owns the theatre, to allow this? In addition to paying for rental, Univision is paying for all eight performances that will be missed during that week.
The following are the Broadway ticket sales numbers for the week ending May 11, 2014: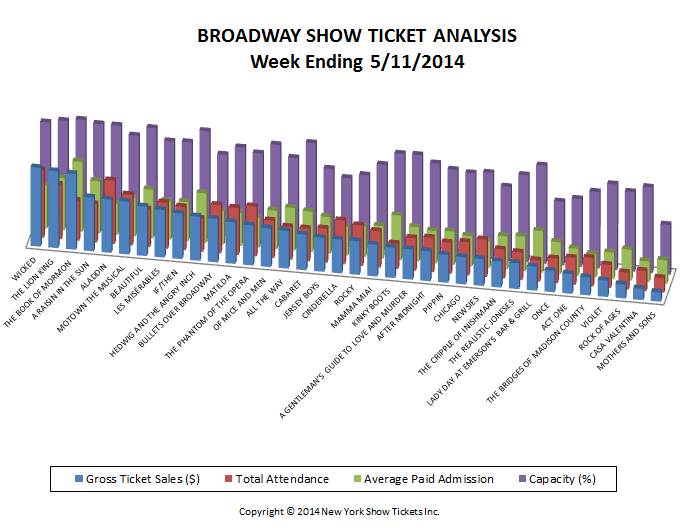
| Show | GrossGross | Total Attn | %Cap | AvgPdAdm |
| A GENTLEMAN’S GUIDE TO LOVE AND MURDER | $663,459 | 7,065 | 97.37% | $93.91 |
| A RAISIN IN THE SUN | $1,184,774 | 8,368 | 100.00% | $141.58 |
| ACT ONE | $433,912 | 5,867 | 67.65% | $73.96 |
| AFTER MIDNIGHT | $658,463 | 7,493 | 90.41% | $87.88 |
| ALADDIN | $1,171,988 | 13,782 | 99.99% | $85.04 |
| ALL THE WAY | $828,296 | 7,120 | 83.45% | $116.33 |
| BEAUTIFUL | $1,087,702 | 8,259 | 100.62% | $131.70 |
| BULLETS OVER BROADWAY | $952,840 | 10,481 | 80.38% | $90.91 |
| CABARET | $783,761 | 7,083 | 99.82% | $110.65 |
| CASA VALENTINA | $249,728 | 4,409 | 85.58% | $56.64 |
| CHICAGO | $597,445 | 7,244 | 83.84% | $82.47 |
| CINDERELLA | $742,072 | 9,536 | 68.08% | $77.82 |
| HEDWIG AND THE ANGRY INCH | $971,988 | 7,210 | 102.28% | $134.81 |
| IF/THEN | $1,001,802 | 9,408 | 89.70% | $106.48 |
| JERSEY BOYS | $744,831 | 7,436 | 75.69% | $100.17 |
| KINKY BOOTS | $668,658 | 5,524 | 96.98% | $121.05 |
| LADY DAY AT EMERSON’S BAR & GRILL | $528,025 | 4,664 | 97.70% | $113.21 |
| LES MISÉRABLES | $1,049,079 | 10,028 | 88.96% | $104.61 |
| MAMMA MIA! | $696,527 | 7,881 | 84.49% | $88.38 |
| MATILDA | $915,544 | 10,217 | 89.18% | $89.61 |
| MOTHERS AND SONS | $203,679 | 3,194 | 49.78% | $63.77 |
| MOTOWN THE MUSICAL | $1,159,405 | 11,032 | 91.51% | $105.09 |
| NEWSIES | $592,716 | 8,132 | 85.78% | $72.89 |
| OF MICE AND MEN | $852,668 | 8,156 | 95.01% | $104.54 |
| ONCE | $469,441 | 5,369 | 63.37% | $87.44 |
| PIPPIN | $615,001 | 6,784 | 85.66% | $90.65 |
| ROCK OF AGES | $310,326 | 3,701 | 79.35% | $83.85 |
| ROCKY | $741,927 | 8,795 | 72.52% | $84.36 |
| THE BOOK OF MORMON | $1,667,542 | 8,752 | 102.63% | $190.53 |
| THE BRIDGES OF MADISON COUNTY | $392,986 | 6,221 | 76.31% | $63.17 |
| THE CRIPPLE OF INISHMAAN | $571,593 | 6,309 | 73.50% | $90.60 |
| THE LION KING | $1,693,549 | 11,904 | 100.03% | $142.27 |
| THE PHANTOM OF THE OPERA | $882,551 | 10,886 | 84.78% | $81.07 |
| THE REALISTIC JONESES | $569,042 | 6,046 | 86.67% | $94.12 |
| VIOLET | $360,843 | 5,014 | 85.39% | $71.97 |
| WICKED | $1,736,317 | 14,711 | 96.88% | $118.03 |
| Totals: | $28,750,477 | 284,081 | 86.43% | $98.65 |
Broadway ticket sales raw data are provided courtesy of The Broadway League All other data, text, opinion, charts and commentary are copyright © 2014 nytix.com