Broadway Show Ticket Sales Analysis For Week Ending 04/07/2013 Reflects A Decline In Ticket Sales Despite Two Shows Joining The Two Millionaires Club
Broadway Ticket Sales Decline
After a few impressive jumps in the total Broadway ticket revenue, this week saw a decrease in sales, bringing in a total of $25,899,686 (down from $28,531,066). This dip was perhaps to be expected given that last week's big leap was due to holiday ticket buying.
The week prior, Broadway took in less than $22 million, so if we compare with that figure instead, this week's receipts still indicate a healthy upward trend in ticket sales as Broadway benefits from Spring tourism.
Four New Broadway Shows Debut
The new shows keep on coming. Bette Midler is putting most of them to shame with I'll Eat You Last: A Chat with Sue Mengers, a one-woman show that nearly sold out at 99.96% capacity, with tickets going for an average paid admission of $133.78. The Broadway revival of Jekyll & Hyde, starring Constantine Maroulis, also began preview performances this week, but at a far less impressive theater capacity of 56.77%.
Alan Cumming's one-man Macbeth is showing healthy signs during its first week on the boards, filling over 85% of the theater at an average paid admission of $105.35. The play The Big Knife did modest business, filling 73.11% with an average paid admission of $51.61.
"Wicked" And "The Lion King" Break Two Million
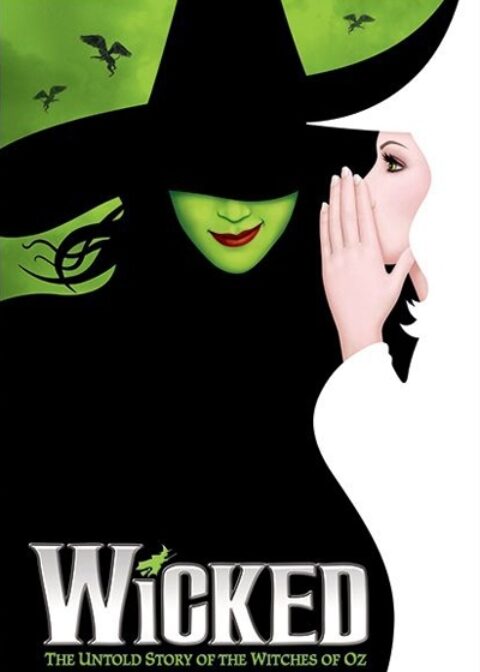
Forget the Millionaires Club, this week saw two Broadway musicals in the Two Millionaires Club. Long-standing favorites Wicked and The Lion King both managed to earn two mil, with Wicked grabbing the top spot at $2,257,034.
The following are the Broadway ticket sales numbers from the week ending April 7, 2013:

| Show Name | GrossGross | TotalAttn | %Cap | AvgPaidAdm |
| ANN | $308,202 | 4,398 | 49.39% | $70.08 |
| ANNIE | $1,120,203 | 12,406 | 90.79% | $90.30 |
| BREAKFAST AT TIFFANY’S | $337,621 | 4,532 | 52.50% | $74.50 |
| CHICAGO | $702,715 | 7,544 | 87.31% | $93.15 |
| CINDERELLA | $1,243,857 | 12,783 | 91.25% | $97.31 |
| HANDS ON A HARDBODY | $240,040 | 4,879 | 58.70% | $49.20 |
| I’LL EAT YOU LAST: A CHAT WITH SUE MENGERS | $313,705 | 2,345 | 99.96% | $133.78 |
| JEKYLL & HYDE | $341,454 | 4,513 | 56.77% | $75.66 |
| JERSEY BOYS | $1,015,051 | 9,002 | 91.63% | $112.76 |
| KINKY BOOTS | $775,687 | 11,271 | 98.94% | $68.82 |
| LUCKY GUY | $1,226,451 | 9,607 | 101.60% | $127.66 |
| MACBETH | $92,285 | 876 | 85.46% | $105.35 |
| MAMMA MIA! | $1,027,152 | 11,226 | 93.67% | $91.50 |
| MATILDA | $915,507 | 9,996 | 100.00% | $91.59 |
| MOTOWN: THE MUSICAL | $1,130,744 | 12,056 | 103.57% | $93.79 |
| NEWSIES | $1,091,883 | 9,611 | 100.53% | $113.61 |
| NICE WORK IF YOU CAN GET IT | $771,078 | 9,128 | 79.29% | $84.47 |
| ONCE | $951,033 | 8,284 | 97.78% | $114.80 |
| ORPHANS | $595,471 | 7,539 | 87.99% | $78.99 |
| PIPPIN | $661,104 | 7,486 | 94.52% | $88.31 |
| ROCK OF AGES | $458,868 | 4,315 | 92.52% | $106.34 |
| SPIDER-MAN TURN OFF THE DARK | $1,409,174 | 13,154 | 85.19% | $107.13 |
| THE ASSEMBLED PARTIES | $156,671 | 3,402 | 74.77% | $46.05 |
| THE BIG KNIFE | $223,376 | 4,328 | 73.11% | $51.61 |
| THE BOOK OF MORMON | $1,705,678 | 8,752 | 102.63% | $194.89 |
| THE LION KING | $2,081,319 | 13,600 | 100.00% | $153.04 |
| THE NANCE | $367,937 | 5,895 | 80.44% | $62.42 |
| THE PHANTOM OF THE OPERA | $1,368,904 | 12,594 | 98.08% | $108.69 |
| THE TESTAMENT OF MARY | $196,495 | 5,030 | 76.20% | $39.06 |
| THE TRIP TO BOUNTIFUL | $441,915 | 6,297 | 74.05% | $70.18 |
| VANYA AND SONIA AND MASHA AND SPIKE | $371,075 | 4,818 | 76.52% | $77.02 |
| WICKED | $2,257,034 | 14,290 | 98.74% | $157.94 |
| Total | $25,899,686 | 255,957 | 86.06% | $94.69 |
Broadway ticket sales raw data are provided courtesy of The Broadway League. All other data, text, opinion, charts and commentary are copyright © 2013 nytix.com.


