By Jennifer R Jones | Posted on August 16, 2016 5:27 PM
In The Week Ending August 14, 2016, The Humans Saw A Slight Increase In Sales; Other Big Musicals Saw Decreases In Ticket Sales.
“The Humans” Moves To Bigger Broadway Theatre After Hiatus
After winning the Tony Award for Best Play, The Humans is on the up and up. Under the experienced guidance of producer Scott Rudin, the play has departed from the Helen Hayes Theatre, where it played from its first preview on January 24, 2016 through until July 24, 2016. After a hiatus, the show picked up performances again on August 9, 2016 at the Gerald Schoenfeld Theatre.
The Schoenfeld is significantly bigger than the Helen Hayes by about 450 seats. The reason for the move is not just because of grander ambitions due to the award win. Rather, the show was always going to be a limited engagement because of pre-planned renovations on the Helen Hayes Theatre, which was recently purchased by the not-for-profit theatre institution Second Stage. The renovations will begin this or next month.
Three Theatres With The Same Cast
The show has now inhabited three theatres with the same cast, starting with the original Off-Broadway run at the Roundabout Theater Company’s Laura Pels Theatre. In addition to winning the Tony Award for Best Play, The Humans won for Best Featured Actor for Reed Birney, Best Featured Actress for Jayne Houdyshell, and Best Set Design for David Zinn.
This past week, the first in the new theatre, The Humans brought in $603,770, which represents 61.84% of its gross potential. Meanwhile, in the previous week of performances, the week ending July 24, 2016, the play brought in less money ($554,398), but that accounted for 95.30% of its gross potential. Therefore, although there is more room for ticket sales, there are also higher running costs at the Schoenfeld, and so The Humans now has bigger shoes to fill to stay afloat.
Some Big Drops For Some Of The Biggest Hits
This past week, some of the longer running hit musicals took a dip. The biggest decrease in ticket sales was seen by Wicked, which brought in $1,779,664 after a decrease of $147,748 from the week before. This represents 100.0% of its gross potential. In addition, Aladdin decreased by $127,368 to reach a weekly gross of $1,663,119, which represents 89.8% of its gross potential.
Matilda, which has now announced its closing date of January 1, 2017, brought in $60,932 less than the week before to reach a weekly gross of $876,824, which represents 73.0% of its gross potential. The Lion King also saw a slight decrease of $58,534 to reach a weekly gross of $2,233,894, which represents 96.9% of its gross potential.
"School Of Rock" Holds Its Own
School of Rock – the Musical, which has continued to hold its own this summer, went down by $50,433 to reach a weekly gross of $1,160,694, or 76.2% of its gross potential. Something Rotten! went down by $49,501 to reach a weekly gross of $584,022, which is 45.7% of its gross potential.
In addition, The Color Purple went down by $37,154, The Book of Mormon went down by $20,600, and even Hamilton went down by $17,767. This past week, Hamilton’s weekly gross was $2,045,095, which represents 105.3% of its gross potential.
The following are the Broadway ticket sales numbers for the week ending August 14, 2016: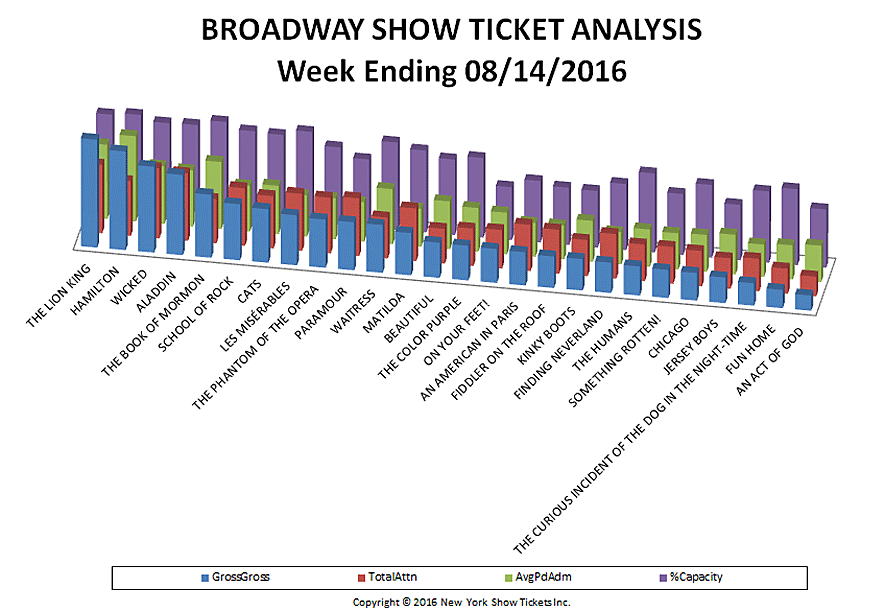
| # | Show Name | GrossGross | TotalAttn | %Capacity | AvgPdAdm |
| 4 | ALADDIN | $1,663,119 | 13,288 | 96.18% | $125.16 |
| 26 | AN ACT OF GOD | $314,205 | 3,877 | 64.36% | $81.04 |
| 16 | AN AMERICAN IN PARIS | $687,762 | 9,111 | 67.83% | $75.49 |
| 13 | BEAUTIFUL | $728,242 | 6,829 | 83.20% | $106.64 |
| 7 | CATS | $1,108,909 | 10,292 | 93.56% | $107.74 |
| 22 | CHICAGO | $571,623 | 6,929 | 80.20% | $82.50 |
| 17 | FIDDLER ON THE ROOF | $652,283 | 8,632 | 63.21% | $75.57 |
| 19 | FINDING NEVERLAND | $628,895 | 8,775 | 72.93% | $71.67 |
| 25 | FUN HOME | $379,242 | 4,966 | 83.89% | $76.37 |
| 2 | HAMILTON | $2,045,095 | 10,756 | 101.78% | $190.14 |
| 23 | JERSEY BOYS | $530,413 | 5,991 | 60.98% | $88.53 |
| 18 | KINKY BOOTS | $651,433 | 7,117 | 62.47% | $91.53 |
| 8 | LES MISÉRABLES | $1,035,397 | 11,244 | 99.75% | $92.08 |
| 12 | MATILDA | $876,824 | 10,341 | 90.27% | $84.79 |
| 15 | ON YOUR FEET! | $703,403 | 7,585 | 58.31% | $92.74 |
| 10 | PARAMOUR | $997,867 | 11,360 | 74.89% | $87.84 |
| 6 | SCHOOL OF ROCK | $1,160,694 | 11,342 | 94.83% | $102.34 |
| 21 | SOMETHING ROTTEN! | $584,022 | 7,239 | 67.48% | $80.68 |
| 5 | THE BOOK OF MORMON | $1,305,962 | 8,731 | 102.38% | $149.58 |
| 14 | THE COLOR PURPLE | $718,400 | 7,367 | 87.62% | $97.52 |
| 24 | THE CURIOUS INCIDENT OF THE DOG IN THE NIGHT-TIME | $464,058 | 6,407 | 78.67% | $72.43 |
| 20 | THE HUMANS | $603,770 | 7,234 | 87.37% | $83.46 |
| 1 | THE LION KING | $2,233,894 | 13,485 | 99.39% | $165.66 |
| 9 | THE PHANTOM OF THE OPERA | $999,632 | 10,966 | 85.40% | $91.16 |
| 11 | WAITRESS | $990,128 | 8,058 | 96.39% | $122.88 |
| 3 | WICKED | $1,779,664 | 13,804 | 95.49% | $128.92 |
| TOTALS | $24,414,933 | 231,726 | 82.65% | $100.94 |