By Jennifer R Jones | Posted on June 01, 2016 12:01 PM
Hamilton Reached Its Second-Highest Gross Of All Time. Cirque Du Soleil’s Paramour Difficulty Selling A Full Week Of Eight Performances.
"Hamilton" Continues To Surpass Its Own Sales Figures
This past week, the week ending May 29, 2016, Hamilton continued to demonstrate that its mega-hit status is undeniable. Spurred on by the tourist traffic of Memorial Day weekend, Hamilton brought in its second-highest weekly gross of all time, beat only by the week ending January 3, 2016, which included the New Year’s holiday.
This week, the gross was $1,917,923, which represents 143.67% of its gross potential over 8 performances. With a top ticket price of $475.00, the average paid admission was $178.38, by far the highest of any show. The second-highest average paid admission this past week was earned by The Book of Mormon, another contemporary hit, whose average ticket price reached $154.17.
"Lion King" and "Wicked" Holding Strong
Just behind came The Lion King, with an average paid admission of $152.93, followed by Wicked, with an average paid admission of $127.33, Shuffle Along, with an average ticket price of $125.85, and Waitress, with an average ticket price of $118.43.
Hamilton has been performing extraordinarily at the box office throughout the entire duration of its run, and yet this past week it managed to increase its weekly gross by $153,115 from the week before. Furthermore, in every week of the run so far this year, the show has fluctuated between 101.7% average audience capacity, and 101.8% average audience capacity.
Cirque Du Soleil’s "Paramour" Plays Full Week For First Time
Since it began previews on April 16, 2016, Cirque du Soleil’s Paramour has been playing partial weeks fluctuating between 4 to 7 performances, while the regular full Broadway performance week is considered to have eight performances. This past week, the week ending May 29, 2016, Paramour played 8 performances in a week for the first time.
This may have been in an effort to capitalize on the increased tourist traffic due to Memorial Day weekend. In any case, the overall weekly gross did increase by $219,143 from last week, which had only 5 performances. Still, the percentage reached of its gross potential significantly dropped, from 92.93% the previous week, to 62.42% this past week.
Difficulty Filling Enormous Lyric Theatre
With a top ticket price of $199.00, the average paid admission was $82.07, and the average audience capacity was 90.5%. This goes to show that even the most spectacle-based show can have difficulty filling the enormous Lyric Theatre, where shows such as Spiderman and On the Town have struggled before. While the overall gross increased, so must have the running costs due to the increased number of performances.
Therefore, at least at this stage of word of mouth and press, these numbers show that Paramour may have a ceiling of the number of audience members who are interested in seeing the show. With more performances, fewer tickets are sold per performance, perhaps demonstrating that this show may have a difficult time selling out full performance weeks and making back its capitalization anytime soon.
The following are the Broadway ticket sales numbers for the week ending May 29, 2016: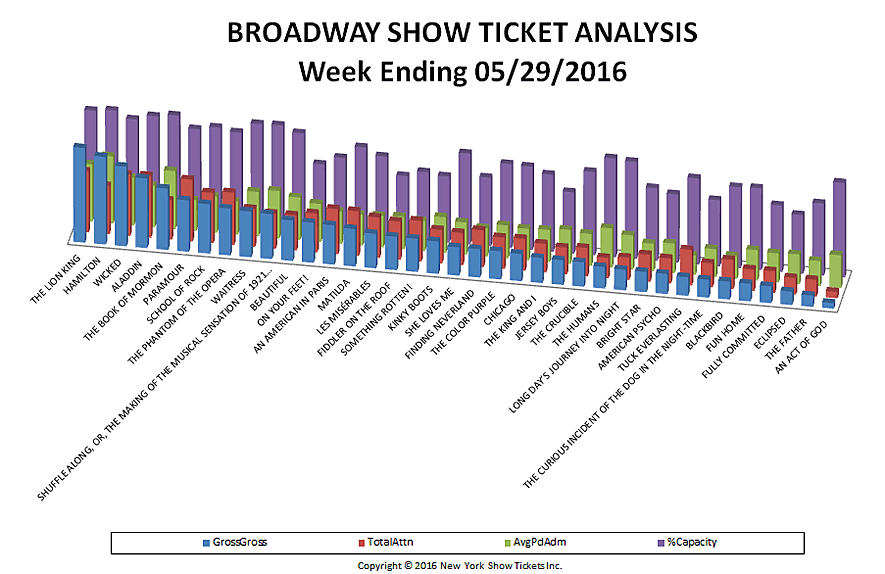
| # | Show Name | GrossGross | TotalAttn | %Capacity | AvgPdAdm |
| 4 | ALADDIN | $1,524,878 | 13,779 | 99.73% | $110.67 |
| 29 | AMERICAN PSYCHO | $440,118 | 5,593 | 67.81% | $78.69 |
| 37 | AN ACT OF GOD | $122,461 | 1,413 | 93.82% | $86.67 |
| 13 | AN AMERICAN IN PARIS | $863,153 | 10,052 | 74.84% | $85.87 |
| 11 | BEAUTIFUL | $889,409 | 7,851 | 95.65% | $113.29 |
| 32 | BLACKBIRD | $392,758 | 6,523 | 80.41% | $60.21 |
| 28 | BRIGHT STAR | $443,293 | 6,032 | 72.22% | $73.49 |
| 22 | CHICAGO | $596,632 | 7,128 | 82.50% | $83.70 |
| 35 | ECLIPSED | $295,071 | 3,737 | 58.25% | $78.96 |
| 16 | FIDDLER ON THE ROOF | $734,036 | 8,505 | 62.28% | $86.31 |
| 20 | FINDING NEVERLAND | $619,504 | 8,184 | 68.02% | $75.70 |
| 34 | FULLY COMMITTED | $371,654 | 4,819 | 65.91% | $77.12 |
| 33 | FUN HOME | $387,952 | 4,807 | 81.20% | $80.71 |
| 2 | HAMILTON | $1,917,923 | 10,752 | 101.74% | $178.38 |
| 24 | JERSEY BOYS | $539,847 | 5,966 | 60.73% | $90.49 |
| 18 | KINKY BOOTS | $710,617 | 7,472 | 65.59% | $95.10 |
| 15 | LES MISÉRABLES | $755,648 | 9,000 | 79.84% | $83.96 |
| 27 | LONG DAY’S JOURNEY INTO NIGHT | $450,190 | 4,962 | 96.44% | $90.73 |
| 14 | MATILDA | $822,013 | 9,974 | 87.06% | $82.42 |
| 12 | ON YOUR FEET! | $876,630 | 8,663 | 66.60% | $101.19 |
| 6 | PARAMOUR | $1,126,943 | 13,731 | 90.53% | $82.07 |
| 7 | SCHOOL OF ROCK | $1,082,056 | 11,243 | 94.01% | $96.24 |
| 19 | SHE LOVES ME | $619,602 | 7,207 | 90.09% | $85.97 |
| 10 | SHUFFLE ALONG, OR, THE MAKING OF THE MUSICAL SENSATION OF 1921 AND ALL THAT FOLLOWED | $985,656 | 7,832 | 101.66% | $125.85 |
| 17 | SOMETHING ROTTEN! | $728,531 | 9,070 | 68.01% | $80.32 |
| 5 | THE BOOK OF MORMON | $1,346,049 | 8,731 | 102.38% | $154.17 |
| 21 | THE COLOR PURPLE | $615,210 | 7,002 | 83.28% | $87.86 |
| 25 | THE CRUCIBLE | $534,686 | 6,295 | 82.83% | $84.94 |
| 31 | THE CURIOUS INCIDENT OF THE DOG IN THE NIGHT-TIME | $393,329 | 5,345 | 65.63% | $73.59 |
| 36 | THE FATHER | $246,823 | 3,717 | 71.48% | $66.40 |
| 26 | THE HUMANS | $471,919 | 4,518 | 98.05% | $104.45 |
| 23 | THE KING AND I | $546,476 | 6,399 | 76.40% | $85.40 |
| 1 | THE LION KING | $2,072,450 | 13,552 | 99.88% | $152.93 |
| 8 | THE PHANTOM OF THE OPERA | $1,026,927 | 11,683 | 90.99% | $87.90 |
| 30 | TUCK EVERLASTING | $410,516 | 7,945 | 85.54% | $51.67 |
| 9 | WAITRESS | $1,001,427 | 8,456 | 101.15% | $118.43 |
| 3 | WICKED | $1,744,424 | 13,700 | 94.77% | $127.33 |
| Totals | $28,706,806 | 291,638 | 82.63% | $94.03 |