By Jennifer R Jones | Posted on September 18, 2015 6:28 PM
In The Week Ending September 13, 2015, Spring Awakening Began Previews To Modest Box Office Results, Also, Hedwig And The Angry Inch Concluded Its Run With An Upsurge In Broadway Ticket Sales
This Week’s Notable Movements on Broadway are:
“Spring Awakening” Begins Previews With Less Than Stellar Numbers
On September 8, 2015, Spring Awakening began previews at the Brooks Atkinson Theatre, playing a full week of eight performances in the week ending September 13, 2015. In its first week out of the gate, the musical brought in $448,879, which represents 44.73% of its gross potential. With a top ticket price of $247.00, the average paid admission was $65.99, demonstrating a fair amount of discounting. This revival of Spring Awakening is unique in that it stars both hearing and non-hearing acting, with certain characters singing the songs and others using American Sign Language. This production is produced by Deaf West Theatre, and is a transfer from a production that received rave reviews in Los Angeles.
Although there has been quite a bit of buzz about this production, the first full week of previews did not demonstrate an overabundance of excitement about the show. However, the fall season is only just beginning to be underway, and thus there is still a lull in audience interest in the new shows beginning previews. Once the show opens on September 27, 2015, the reviews will help spread awareness of the production and there is a chance that ticket sales will continue to pick up. The last time Spring Awakening was on Broadway was 2006, when the musical ran until 2009. Therefore, this is a pretty quick turnaround for a revival, even if the production differs in its casting and stylistic choices.
“Hedwig and the Angry Inch” Shows Upturn in Final Week on Broadway
On September 13, 2015, Hedwig and the Angry Inch played its final performance on Broadway. The show had been running at the Belasco Theatre for a year and a half, since it began previews on March 29, 2014. It won the Tony Award for Best Revival of a Muscial among other awards, and broke the record for the longest running show at the Belasco Theatre. Over the course of the run, the lead role of Hedwig was portrayed by a variety of stars. By far the biggest box office attraction was the opening cast member, Neil Patrick Harris, who brought in well over a million dollars per week during his run. Following Harris, the show starred Andrew Rannells, then Michael C. Hall, then John Cameron Mitchell himself in the role he created, then Darren Criss, and then finally Taye Diggs, who was the closing performer.
Though Diggs did not cause the greatest box office numbers during most of his weeks in the role, the final week did show an upturn. In the week ending September 13, 2015, Hedwig and the Angry Inch brought in $625,159, which represented 88.12% of the show’s gross potential, and which was an increase of $178,208 from the week before. In contrast, the previous week brought in $446,951, which represented 63.00% of its gross potential. Also, the houses were completely full, with the average audience capacity at 100.1% throughout the seven performances. In contrast, the previous week had an average audience capacity of 80.8%. The show will continue to delight audiences on the road, including international runs in London and Australia.
The Following are the Broadway Ticket Sales Numbers for the Week Ending September 13, 2015:
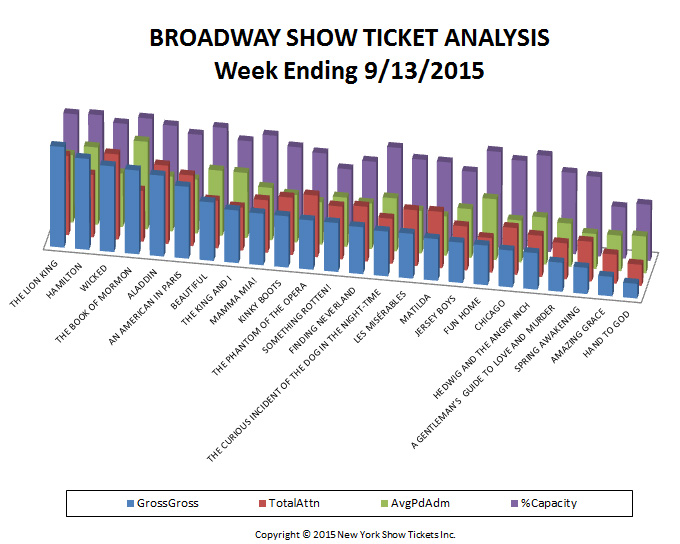
| Show Name | GrossGross | TotalAttn | %Capacity | AvgPdAdm |
| A GENTLEMAN’S GUIDE TO LOVE AND MURDER | $499,576 | 6,149 | 84.74% | $81.24 |
| ALADDIN | $1,386,168 | 13,405 | 97.03% | $103.41 |
| AMAZING GRACE | $332,663 | 4,970 | 53.46% | $66.93 |
| AN AMERICAN IN PARIS | $1,233,473 | 12,093 | 90.03% | $102.00 |
| BEAUTIFUL | $1,002,586 | 8,162 | 99.44% | $122.84 |
| CHICAGO | $631,817 | 8,008 | 92.69% | $78.90 |
| FINDING NEVERLAND | $805,827 | 9,382 | 77.98% | $85.89 |
| FUN HOME | $679,175 | 5,910 | 99.83% | $114.92 |
| HAMILTON | $1,561,640 | 10,703 | 101.28% | $145.91 |
| HAND TO GOD | $250,923 | 3,611 | 58.47% | $69.49 |
| HEDWIG AND THE ANGRY INCH | $625,159 | 7,058 | 100.13% | $88.57 |
| JERSEY BOYS | $691,833 | 7,522 | 76.57% | $91.97 |
| KINKY BOOTS | $878,766 | 9,804 | 86.06% | $89.63 |
| LES MISÉRABLES | $768,084 | 9,538 | 84.62% | $80.53 |
| MAMMA MIA! | $886,681 | 8,980 | 95.94% | $98.74 |
| MATILDA | $715,374 | 9,647 | 84.21% | $74.16 |
| SOMETHING ROTTEN! | $839,012 | 9,039 | 67.78% | $92.82 |
| SPRING AWAKENING | $448,879 | 6,802 | 82.87% | $65.99 |
| THE BOOK OF MORMON | $1,438,096 | 8,721 | 102.26% | $164.90 |
| THE CURIOUS INCIDENT OF THE DOG IN THE NIGHT-TIME | $768,656 | 7,711 | 94.68% | $99.68 |
| THE KING AND I | $903,608 | 7,361 | 87.88% | $122.76 |
| THE LION KING | $1,727,320 | 13,563 | 99.96% | $127.36 |
| THE PHANTOM OF THE OPERA | $844,824 | 10,544 | 82.12% | $80.12 |
| WICKED | $1,472,236 | 14,570 | 94.56% | $101.05 |
| Totals | $21,392,373 | 213,253 | 87.27% | $97.91 |
Broadway ticket sales raw data are provided courtesy of The Broadway League All other data, text, opinion, charts and commentary are copyright © 2015 nytix.com