By Jennifer R Jones | Posted on July 05, 2016 1:00 PM
Broadway Show Ticket Sales Analysis For Week Ending 07/03/2016. Overall, Broadway Sees Slow Period, Only 8 Shows With An Increase.
Broadway Takes A Slight Dip In Mid-Summer
In the week ending July 3, 2016, the Broadway industry experienced a collective slow period. Of the 29 shows that were running this past week, only 8 saw an increase in ticket sales, and no show increased by much more than $50,000 from the week before. On the other hand, several shows decreased by six-figure amounts, and the majority of shows experienced a decrease to some extent.
In addition, three shows had closed the week before, compounding the overall sluggishness of the box office this week. Overall, the 29 shows demonstrated a total decrease of $838,589 from the week before. The previous week, the average gross per show was $926,629, but this past week, the average went down to $897,712.
Healthy Numbers With A Downward Trend
Furthermore, in the previous week, the average percentage reached of gross potential was 71.13%, but this past week, it was 68.12%. With a top ticket price of $260.78 on average, the average paid admission for all shows running this past week was $102.51. These are still relatively healthy numbers, as fitting for the summer season, but on a week-to-week basis, it was a bit of a downward move.
“The Lion King” And “Hamilton” Are Leading The Pack
This past week, the only two shows to break the 2 million dollar mark were The Lion King and Hamilton. The Lion King, which has been running since October 1997, is regularly the highest-grossing film on Broadway each week, often neck and neck with Wicked. The Lion King plays in the Minskoff Theatre, which has approximately 1,710 seats, making it one of the larger venues on Broadway.
This is one of the reasons it can bring in such high grosses. Hamilton, on the other hand, is a newer phenomenon, having just won the 2016 Tony Award for Best Musical. Unlike The Lion King and Wicked, Hamilton plays in a more modest-sized theatre, the Richard Rodgers Theatre, which has approximately 1,400 seats. This makes it all the more impressive that this show has now broken through the 2 million dollar mark on multiple occasions.
Wicked Performs In One Of The Biggest Theatres On Broadway
This past week, The Lion King brought in $2,164,298, which represents 101.1% of its gross potential. In comparison, Hamilton brought in $2,022,790, which represents 104.1% of its gross potential. Therefore, even though the weekly gross amount for Hamilton was less, it was actually a greater percentage of the show’s potential given the number of seats in the theatre and the pricing for those seats.
The third highest-grossing show this past week was indeed Wicked, which brought in $1,863,121, which represents 104.7% of its gross potential. Nevertheless, that is a decrease of $106,038 from the week before, when it brought in an incredible 110.64% of its gross potential, with a weekly gross of $1,969,159. Wicked plays in the Gershwin Theatre, which has approximately 1,933 seats, making it one of the biggest theatres on the Broadway landscape.
The following are the Broadway ticket sales numbers for the week ending July 3, 2016: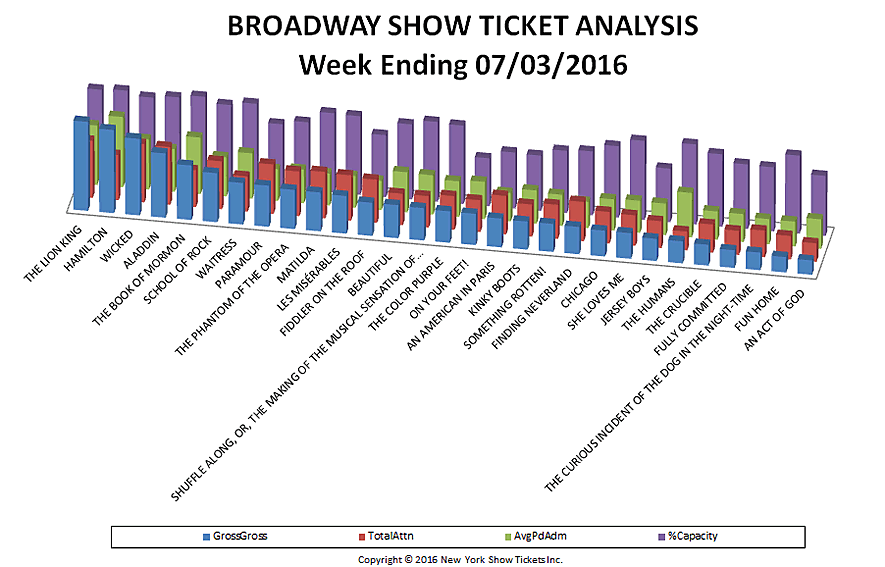
| # | Show Name | GrossGross | TotalAttn | %Capacity | AvgPdAdm |
| 4 | ALADDIN | $1,564,928 | 13,683 | 99.04% | $114.37 |
| 29 | AN ACT OF GOD | $348,283 | 4,393 | 72.92% | $79.28 |
| 17 | AN AMERICAN IN PARIS | $699,977 | 9,143 | 68.07% | $76.56 |
| 13 | BEAUTIFUL | $805,532 | 7,484 | 91.18% | $107.63 |
| 21 | CHICAGO | $628,426 | 7,497 | 86.77% | $83.82 |
| 12 | FIDDLER ON THE ROOF | $808,911 | 10,286 | 75.32% | $78.64 |
| 20 | FINDING NEVERLAND | $662,985 | 9,350 | 77.71% | $70.91 |
| 26 | FULLY COMMITTED | $430,791 | 5,743 | 78.54% | $75.01 |
| 28 | FUN HOME | $375,628 | 5,608 | 94.73% | $66.98 |
| 2 | HAMILTON | $2,022,790 | 10,739 | 101.62% | $188.36 |
| 23 | JERSEY BOYS | $540,597 | 6,394 | 65.09% | $84.55 |
| 18 | KINKY BOOTS | $682,678 | 7,645 | 67.11% | $89.30 |
| 11 | LES MISÉRABLES | $917,109 | 10,777 | 95.61% | $85.10 |
| 10 | MATILDA | $946,216 | 11,047 | 96.43% | $85.65 |
| 16 | ON YOUR FEET! | $759,324 | 7,580 | 58.27% | $100.17 |
| 8 | PARAMOUR | $1,000,312 | 11,748 | 77.45% | $85.15 |
| 6 | SCHOOL OF ROCK | $1,194,312 | 11,396 | 95.28% | $104.80 |
| 22 | SHE LOVES ME | $624,045 | 7,239 | 96.10% | $86.21 |
| 14 | SHUFFLE ALONG, OR, THE MAKING OF THE MUSICAL SENSATION OF 1921 AND ALL THAT FOLLOWED | $787,622 | 7,464 | 96.88% | $105.52 |
| 19 | SOMETHING ROTTEN! | $681,072 | 8,113 | 75.62% | $83.95 |
| 5 | THE BOOK OF MORMON | $1,324,390 | 8,742 | 102.51% | $151.50 |
| 15 | THE COLOR PURPLE | $764,798 | 8,009 | 95.25% | $95.49 |
| 25 | THE CRUCIBLE | $507,081 | 6,693 | 88.07% | $75.76 |
| 27 | THE CURIOUS INCIDENT OF THE DOG IN THE NIGHT-TIME | $428,289 | 6,334 | 77.78% | $67.62 |
| 24 | THE HUMANS | $535,415 | 4,485 | 97.33% | $119.38 |
| 1 | THE LION KING | $2,164,298 | 13,573 | 100.04% | $159.46 |
| 9 | THE PHANTOM OF THE OPERA | $953,783 | 10,606 | 82.60% | $89.93 |
| 7 | WAITRESS | $1,010,938 | 8,324 | 99.57% | $121.45 |
| 3 | WICKED | $1,863,121 | 13,874 | 95.97% | $134.29 |
| TOTALS | $26,033,649 | 253,969 | 86.51% | $98.86 |