By Jennifer R Jones | Posted on September 29, 2015 1:52 PM
In The Week Ending September 27, 2015, Two New Anticipated Shows Began Previews: The Gin Game And Dames At Sea, The Overall Week Was Unfortunately A Slow One On Broadway
This Week’s Notable Movements on Broadway are:
Two New Shows: “The Gin Game” and “Dames at Sea”
In the week ending September 27, 2015, two new shows began previews on Broadway. The first, The Gin Game, started previews on September 23, 2015 and played 6 performances in its first week. Starring Cicely Tyson and James Earl Jones, this two hander by D.L. Coburn was directed by Leonard Foglia. In its first partial week, the show brought in $321,538, which represents 53.98% of its gross potential. With a top ticket price of $223.00, the average paid admission was $68.40, and the average audience capacity was 97.7%. This demonstrates a fair amount of discounting, and also the first preview performance is often fully or mostly given away as complimentary tickets to friends of the production.
The first week of previews is often skewed, and this may account for the lower average gross across the preview performances. As for Dames at Sea, this show began previews on September 24, 2015, and played five shows in the first week. A lesser known show and starring lesser name actors, Dames at Sea brought in only $144,944, which represents 39.44% of its gross potential. With a top ticket price of an ambitious $277.00, the average paid admission was $56.11. The average audience capacity was 88.6%, showing less overall interest even with significant discounting. Of a potential 2,915 seats to sell over the partial week, the production sold 2,583.
An Overall Slump Week for Broadway
In comparison to the previous week, the week ending September 27, 2015 saw an overall decrease of $1,349,637 across the 26 shows currently running. Other than the two shows that began previews this week, as well as Old Times and Fool for Love which played their first full weeks of eight performances this week, there were only three shows that demonstrated an increase in ticket sales this week. Those were Hamilton with an increase of $22,105, Beautiful with an increase of $20,859, and The Book of Mormon with an increase of $11,419. All of these were modest increases. Otherwise, all the presently running shows saw a decrease in sales.
The biggest decrease was seen by Les Miserables, which went down by $161,507, bringing in a weekly gross of $675,925. Finding Neverland also had a significant decrease of $145,952, bringing in a weekly gross of $735,143. Wicked went down by $144,379 to reach a weekly gross of $1,426,156, and Something Rotten! went down by $142,840 to reach a weekly gross of $837,128. Two British shows also saw six figure decreases, with Matilda going down by $141,565, and The Curious Incident of the Dog in the Night-time going down by $138,402.
A Closer Look at the Broadway Box Office Decreases
Further six figure decreases were seen by Jersey Boys with a decrease of $128,332, Chicago with a decrease of $122,946, The King and I with a decrease of $121,833, The Phantom of the Opera with a decrease of $109,682, and Aladdin with a decrease of $102,846. The reason for this slump is not exactly clear, but may be attributed to the fact that the fall season is still just gearing up, and many of the new shows have not begun previews yet. On the other hand, many New Yorkers are preoccupied with the start of the school year and other fall activities.
The Following are the Broadway Ticket Sales Numbers for the Week Ending September 27, 2015:
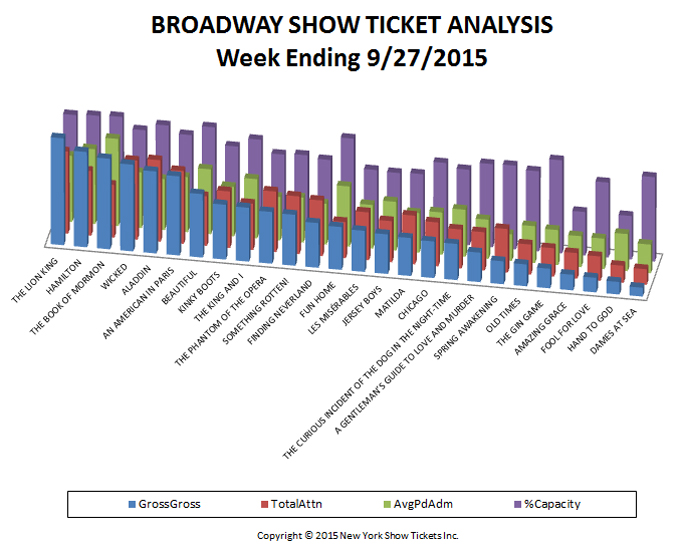
| Show Name | GrossGross | TotalAttn | %Capacity | AvgPdAdm |
| A GENTLEMAN’S GUIDE TO LOVE AND MURDER | $485,184 | 6,330 | 87.24% | $76.65 |
| ALADDIN | $1,347,833 | 13,491 | 97.65% | $99.91 |
| AMAZING GRACE | $256,284 | 4,240 | 45.61% | $60.44 |
| AN AMERICAN IN PARIS | $1,301,184 | 12,055 | 89.75% | $107.94 |
| BEAUTIFUL | $1,042,972 | 8,208 | 100.00% | $127.07 |
| CHICAGO | $601,777 | 7,267 | 84.11% | $82.81 |
| DAMES AT SEA | $144,944 | 2,583 | 88.61% | $56.11 |
| FINDING NEVERLAND | $735,143 | 9,201 | 76.47% | $79.90 |
| FOOL FOR LOVE | $239,768 | 4,022 | 78.68% | $59.61 |
| FUN HOME | $703,265 | 5,980 | 101.01% | $117.60 |
| HAMILTON | $1,567,451 | 10,712 | 101.36% | $146.33 |
| HAND TO GOD | $205,062 | 2,821 | 45.68% | $72.69 |
| JERSEY BOYS | $650,035 | 6,802 | 69.24% | $95.57 |
| KINKY BOOTS | $901,823 | 9,336 | 81.95% | $96.60 |
| LES MISÉRABLES | $675,925 | 7,913 | 70.20% | $85.42 |
| MATILDA | $624,478 | 8,046 | 70.23% | $77.61 |
| OLD TIMES | $358,413 | 4,976 | 84.05% | $72.03 |
| SOMETHING ROTTEN! | $837,128 | 9,542 | 79.31% | $87.73 |
| SPRING AWAKENING | $375,985 | 7,204 | 87.77% | $52.19 |
| THE BOOK OF MORMON | $1,489,769 | 8,733 | 102.40% | $170.59 |
| THE CURIOUS INCIDENT OF THE DOG IN THE NIGHT-TIME | $593,677 | 6,444 | 79.13% | $92.13 |
| THE GIN GAME | $321,528 | 4,701 | 97.69% | $68.40 |
| THE KING AND I | $886,004 | 7,643 | 91.25% | $115.92 |
| THE LION KING | $1,758,556 | 13,570 | 100.01% | $129.59 |
| THE PHANTOM OF THE OPERA | $850,070 | 10,001 | 77.89% | $85.00 |
| WICKED | $1,426,156 | 13,083 | 90.50% | $109.01 |
| Totals | $20,380,414 | 204,904 | 83.76% | $93.26 |
Broadway ticket sales raw data are provided courtesy of The Broadway League All other data, text, opinion, charts and commentary are copyright © 2015 nytix.com