By Jennifer R Jones | Posted on September 01, 2015 7:34 PM
On The Town Brought In A Significant Increase This Past Week As It Concluded Its Penultimate Week Of Ticket Sales.
Continuing On A Downward Pattern Before Fall Season
In the week ending August 30, 2015, the Broadway industry as a whole continued to see a decrease in sales. Like last week, the majority of shows saw a decrease in ticket sales compared to the week before, but most of the numbers were not huge. Also like last week, the biggest decreases were seen by the highest-grossing musicals, namely The Lion King and Wicked.
Of the 24 shows that were running this past week, only four saw an increase in ticket sales. By far the highest increase was seen by On the Town, in its penultimate week of performances having announced the closure of the run. The show brought in a weekly gross of $914,434, which was an increase of $519,055 from the week before.
"Hamilton" Buzzing On Broadway
Following this large six-figure increase, the next biggest increase was seen by Hamilton, the buzziest new musical on Broadway. This week, the gross for Hamilton was $1,548,928, which is an increase of $92,175 from the week before.
This is also the highest gross for Hamilton yet, reaching a remarkable 116.03% of its gross potential as increasingly hungry fans have a more and more difficult time finding tickets. The only other two shows that saw an increase in sales were Beautiful, with an increase of $15,043 to reach a weekly gross of $901,998, and Les Miserables, with an increase of $13,291 to reach a weekly gross of $754,427.
“On the Town” Sees Major Increase In Penultimate Week Of Performances
Of the 24 shows that ran last week, the only six figure increase was seen by On the Town. Having been running in performances since it began previews on September 20, 2014, On the Town has had a difficult time consistently selling full houses in the gigantic Lyric Theatre.
Formerly known as the Foxwoods, this is where the spectacle filled Spiderman: Turn Off the Dark had actors flying through the lofted ceilings to the balcony. On the Town is a much more traditional musical, and the dancers stick to the stage. Still, the Lyric is a very large venue to fill each night. As it was recently announced that the final performance would be September 6, 2015, audiences are taking notice and ticket sales increased by a great amount this past week.
Decreases In Ticket Sales Across The Board
Whereas almost all other shows experienced a decrease in ticket sales, even the big musicals The Lion King, Wicked, and Aladdin, the biggest increase was seen by On the Town. This past week, the show brought in $914,434, which represents 51.08% of its gross potential. Though this is by no means stupendous, it is a significant increase – not only from the previous week’s percentage reached of gross potential of 22.09%, but also from the entire run.
On the Town has not brought in this much money at the box office since its first week of performances – the week ending January 4, 2015 – when it brought in $968,359, representing 54.10% of its gross potential. Other than its first and most recent weeks, the show has only cracked $700,000 once, and has often brought in gross potential percentages in the 20% range. We will see how well the show does next week in its final week of performances.
The following are the Broadway ticket sales numbers for the week ending August 30, 2015: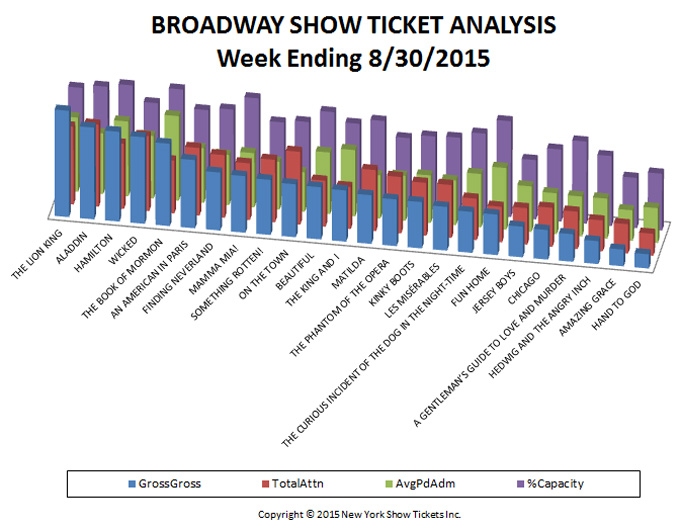
| Show Name | GrossGross | TotalAttn | %Capacity | AvgPdAdm |
| A GENTLEMAN’S GUIDE TO LOVE AND MURDER | $475,706 | 6,154 | 84.86% | $77.30 |
| ALADDIN | $1,582,804 | 13,487 | 97.62% | $117.36 |
| AMAZING GRACE | $286,912 | 4,833 | 51.99% | $59.37 |
| AN AMERICAN IN PARIS | $1,175,967 | 11,109 | 82.71% | $105.86 |
| BEAUTIFUL | $901,998 | 7,565 | 92.17% | $119.23 |
| CHICAGO | $508,839 | 6,424 | 74.35% | $79.21 |
| FINDING NEVERLAND | $1,000,776 | 10,303 | 85.63% | $97.13 |
| FUN HOME | $700,011 | 5,859 | 98.97% | $119.48 |
| HAMILTON | $1,548,928 | 10,710 | 101.34% | $144.62 |
| HAND TO GOD | $245,469 | 3,622 | 58.65% | $67.77 |
| HEDWIG AND THE ANGRY INCH | $394,709 | 5,087 | 72.17% | $77.59 |
| JERSEY BOYS | $529,457 | 6,001 | 61.09% | $88.23 |
| KINKY BOOTS | $800,205 | 8,684 | 76.23% | $92.15 |
| LES MISÉRABLES | $754,427 | 8,702 | 77.20% | $86.70 |
| MAMMA MIA! | $977,098 | 9,313 | 99.50% | $104.92 |
| MATILDA | $841,368 | 10,043 | 87.67% | $83.78 |
| ON THE TOWN | $914,434 | 11,946 | 79.68% | $76.55 |
| SOMETHING ROTTEN! | $951,034 | 10,259 | 76.93% | $92.70 |
| THE BOOK OF MORMON | $1,420,003 | 8,675 | 101.72% | $163.69 |
| THE CURIOUS INCIDENT OF THE DOG IN THE NIGHT-TIME | $707,099 | 6,824 | 83.79% | $103.62 |
| THE KING AND I | $885,496 | 6,908 | 82.47% | $128.18 |
| THE LION KING | $1,835,217 | 12,778 | 94.18% | $143.62 |
| THE PHANTOM OF THE OPERA | $806,639 | 9,275 | 72.24% | $86.97 |
| WICKED | $1,492,152 | 12,334 | 85.32% | $120.98 |
| Totals | $21,736,746 | 206,895 | 82.44% | $101.54 |