In The Week Ending April 5, 2015, Two New Shows Began Performances – Living On Love And Airline Highway, With Mediocre Box Office Performance.
New Shows: “Living on Love” And “Airline Highway”
In the week ending April 5, 2015, two new shows began previews on Broadway. First of all, Living on Love began previews on April 1, 2015 at the Longacre Theatre. Written by Joe DiPietro (Nice Work if You Can Get It) based on a play called Peccadillo by Garson Kanin, Living on Love is directed by Kathleen Marshall (Anything Goes) and stars opera singer Renee Fleming in her Broadway debut.
Over the course of its first five performances, it brought in $126,172, which represents only 26.13% of its gross potential. With a top ticket price of $275.00, the average paid admission was $31.73, which represents very heavy discounting. Furthermore, the show filled up 74.1% of its audience capacity, so many of these tickets must have been complimentary in addition to discounted.
Rare MTC Female Production
In addition, Airline Highway began previews on April 1, 2015 at the Samuel J. Friedman Theatre in a Manhattan Theatre Club production. Written by Lisa D’Amour (Detroit) and directed by Joe Mantello (An Act of God), Airline Highway is one of the rare MTC productions on Broadway to be written by a woman in recent years.
In its first six performances, the show only brought in $90,799, which represents 20.54% of its gross potential. The average paid admission was $34.67, and average audience capacity was at 69.6%. Fortunately, an MTC production can afford these low wraps more than a commercial work such as Living on Love, as the not-for-profit’s endowment should help make up for some of these losses.
Big Leaps In A Nine-Show Week
This past week, three of the top-grossing musicals on Broadway made the choice to play for nine performances, up from the usual eight. It is unclear why all three of these shows made this decision for the same reason, although two of them – Aladdin and The Lion King – are both Disney Theatricals productions and therefore probably made this choice in tandem.
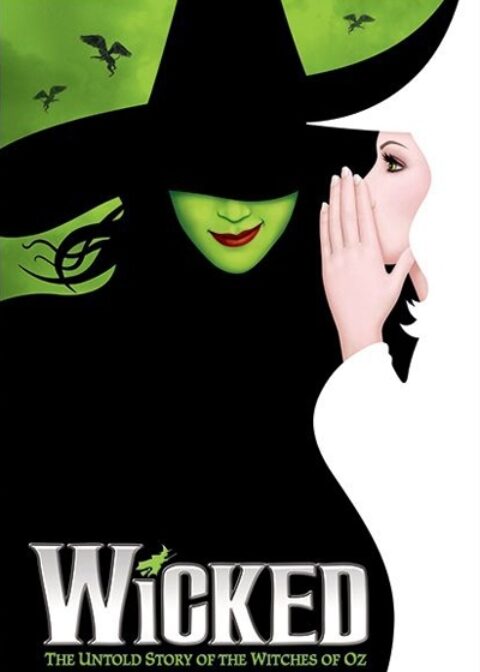
The third show is Wicked, which along with those two is generally at the top of the box office charts. In the week ending April 5, 2015, therefore, each of these shows saw a major increase in ticket sales. The Lion King went up by $569,329, which is accounted for not just by the extra performance, as the gross potential also went up to 100.78% from 99.2% the week before.
Increases For Wicked And Aladdin
Wicked saw an increase of $486,223, and Aladdin went up by $454,855. One of the reasons that these three musicals chose to add a performance may have been due to the timing of spring break, as these three shows are all major fare for tourists and families alike.
The following are the Broadway ticket sales numbers for the week ending April 5, 2015:
| Show Name | GrossGross | Total Attn | %Capacity | AvgPdAdm |
| A GENTLEMAN’S GUIDE TO LOVE AND MURDER | $617,753 | 6,475 | 89.24% | $95.41 |
| AIRLINE HIGHWAY | $90,799 | 2,619 | 69.62% | $34.67 |
| ALADDIN | $2,024,667 | 15,508 | 100.01% | $130.56 |
| AN AMERICAN IN PARIS | $967,151 | 12,114 | 92.28% | $79.84 |
| BEAUTIFUL | $835,957 | 7,312 | 89.08% | $114.33 |
| CHICAGO | $669,411 | 7,463 | 86.38% | $89.70 |
| DOCTOR ZHIVAGO | $368,018 | 7,480 | 72.30% | $49.20 |
| FINDING NEVERLAND | $1,153,212 | 11,804 | 99.76% | $97.70 |
| FISH IN THE DARK | $1,196,788 | 8,720 | 101.58% | $137.25 |
| FUN HOME | $310,222 | 4,221 | 90.54% | $73.49 |
| GIGI | $585,448 | 8,619 | 90.80% | $67.93 |
| HAND TO GOD | $213,302 | 4,848 | 77.49% | $44.00 |
| HEDWIG AND THE ANGRY INCH | $493,136 | 5,454 | 77.37% | $90.42 |
| HONEYMOON IN VEGAS | $368,966 | 5,371 | 58.38% | $68.70 |
| IT SHOULDA BEEN YOU | $310,872 | 5,473 | 69.95% | $56.80 |
| IT’S ONLY A PLAY | $514,337 | 6,093 | 70.72% | $84.41 |
| JERSEY BOYS | $710,080 | 7,466 | 76.00% | $95.11 |
| KINKY BOOTS | $937,627 | 9,165 | 80.45% | $102.31 |
| LES MISÉRABLES | $981,252 | 10,848 | 96.24% | $90.45 |
| LIVING ON LOVE | $126,172 | 3,977 | 74.13% | $31.73 |
| MAMMA MIA! | $813,160 | 8,884 | 95.24% | $91.53 |
| MATILDA | $1,416,637 | 11,493 | 100.32% | $123.26 |
| ON THE TOWN | $563,746 | 9,468 | 63.15% | $59.54 |
| ON THE TWENTIETH CENTURY | $509,348 | 5,398 | 93.46% | $94.36 |
| SKYLIGHT | $625,494 | 6,201 | 96.65% | $100.87 |
| SOMETHING ROTTEN! | $507,102 | 10,257 | 95.33% | $49.44 |
| THE AUDIENCE | $1,142,590 | 7,505 | 100.29% | $152.24 |
| THE BOOK OF MORMON | $1,517,640 | 8,751 | 102.61% | $173.42 |
| THE CURIOUS INCIDENT OF THE DOG IN THE NIGHT-TIME | $749,788 | 7,412 | 91.01% | $101.16 |
| THE HEIDI CHRONICLES | $275,393 | 3,994 | 49.88% | $68.95 |
| THE KING AND I | $828,367 | 8,376 | 100.00% | $98.90 |
| THE LION KING | $2,633,531 | 15,295 | 99.97% | $172.18 |
| THE PHANTOM OF THE OPERA | $1,230,960 | 11,142 | 86.78% | $110.48 |
| THE VISIT | $214,803 | 5,155 | 71.52% | $41.67 |
| WICKED | $2,358,372 | 15,857 | 91.48% | $148.73 |
| WOLF HALL PARTS ONE & TWO | $689,541 | 8,127 | 73.45% | $84.85 |
| Totals | $29,551,639 | 294,345 | 85.37% | $91.82 |


